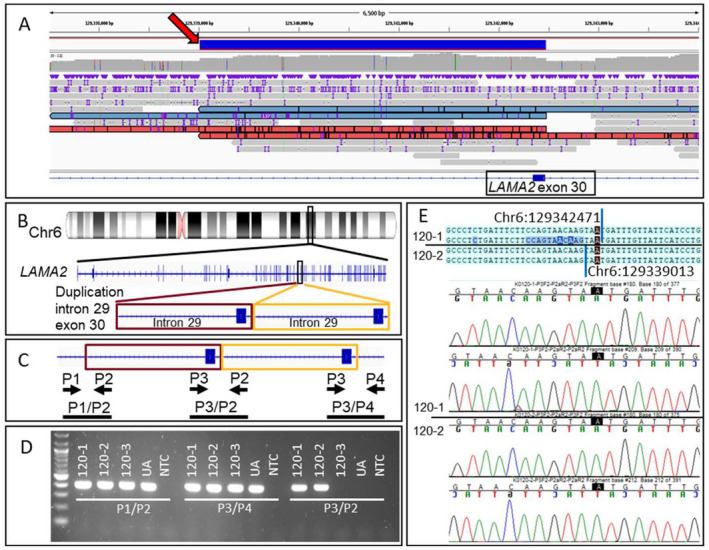
Figure 3.

Detection and confirmation of duplication in LAMA2 for family 120. (A) View of nanopore LRS reads in the region of the 3463 bp duplication. A red arrow points to the solid blue bar that represents the duplicated region. Reads supporting the duplication are shown in red or blue. The IGV view shows ~6500 bp from chr6:129,337,495–129,343,993 (hg38). (B) Diagram indicates the location of the chromosome 6 duplication found on LRS that falls within LAMA2. The IGV view shows 27 bp from chr6:129,297,778–129,297,804 (hg38). (C) Diagram indicates relative positions of primers P1, P2, P3, and P4 in duplicated gDNA. Primer pair P3/P2 should only produce an amplicon if the duplication is present. Maroon and gold boxes outline the duplicated region and the black bars show expected amplicons. (D) PCR reactions are performed using primer sets P1/P2, P3/P4, and P3/P2 to amplify gDNA extracted from 120‐1 (proband), 120‐2 (mother), 120‐3 (father), and a control UA. A NTC is also included in all reactions. Primers P3/P2 yield an ~400 bp amplicon in 120‐1 and 120‐2, indicating that these two individuals carry the duplication, whereas 120‐3 and the unaffected individual do not. (E) Sanger sequencing of the P3/P2 amplicon from 120‐1 and 120‐2 confirms the tandem duplication and refines the breakpoint positions as chr6:129,339,013 and chr6:129,342,471 (hg38). Sequence data from proband and mother are separated by a black line. LRS, long‐read sequencing; IGC, integrative genomics viewer; ua, unaffected individual; NTC, no template control. [Colour figure can be viewed at wileyonlinelibrary.com]
