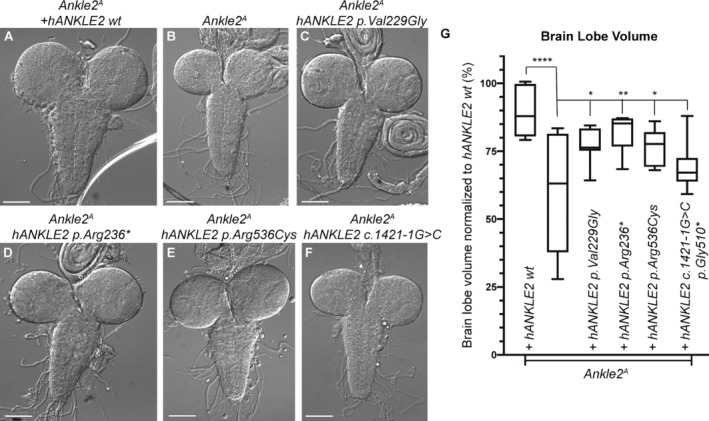
Figure 6.

Functional modeling of ANKLE2 variants recapitulates microcephaly phenotypes in Drosophila melanogaster. (A–F) Bright field images of third instar larval brains from (A) Ankle2 A , da‐hANKLE2 wt, (B) Ankle2 A , (C) Ankle2 A , da‐hANKLE2 p.Val229Gly, (D) Ankle2 A , da‐hANKLE2 p.Arg236*, (E) Ankle2 A , da‐hANKLE2 p.Arg536Cys, (F) Ankle2 A , da‐hANKLE2 c.1421‐1G>C. (G) Brain volume quantification of animals from (A–F). One‐way ANOVA with post hoc test. *p < 0.05, **p < 0.01, ****p < 0.0001.
