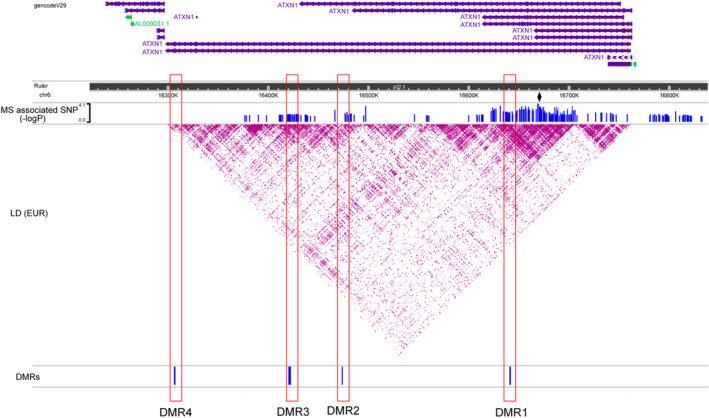
Figure 3.

ATXN1 DMRs overlap with MS‐risk variants. The plot displays the linkage‐disequilibrium (LD) across the ATXN1 locus according to r 2 values calculated from the European dataset in the 1000 Genomes Project. Variants associated with MS susceptibility with nominal significance (p < 0.05) in the most recent MS meta‐analysis from the International Multiple Sclerosis Genetics Consortium (IMSGC) are also depicted. The diamond highlights the strongest association in the meta‐analysis (rs719316) mapping to the third intron of ATXN1. The DMRs are shown below the LD plot. [Colour figure can be viewed at wileyonlinelibrary.com]
