
Figure 9.
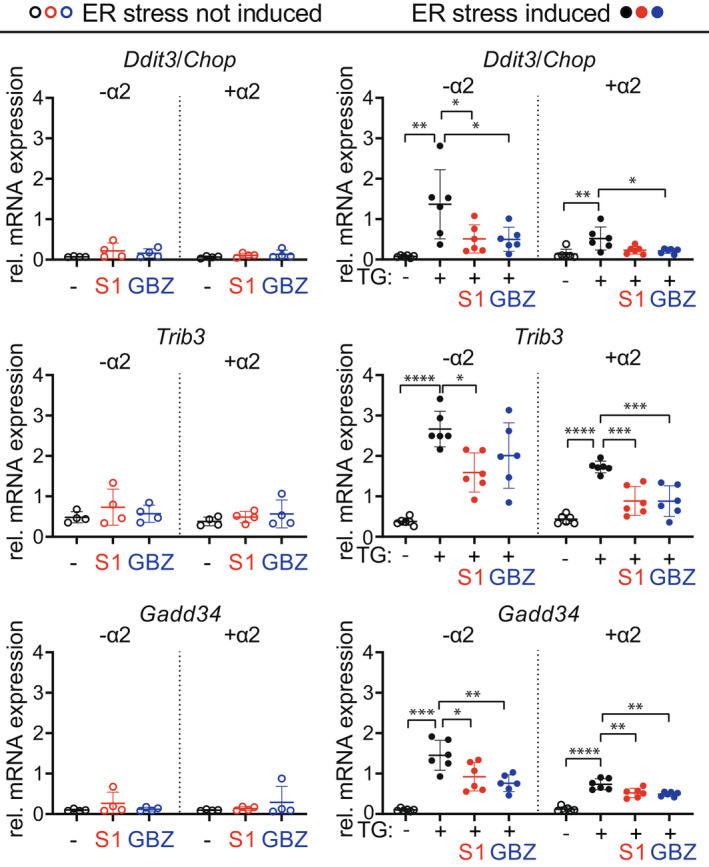
GBZ and S1 attenuates ISR parameters similarly in the absence or presence of the α2‐AR. AtT‐20 cells that express (+α2) or not express (−α2) the α2‐AR subtype 2A were treated with vehicle (−) or thapsigargin (TG: +) for 6 h, in the presence or absence of 50 μmol/L S1 or GBZ to induce ER stress. ISR mRNA marker expression was quantified with qPCR (Akt as reference). Graphs indicate individual data points and means ± SD. Shown ISR markers differ significantly in vehicle‐treated versus TG‐treated cells, as analyzed with an unpaired t‐test or the appropriate non‐parametric alternative. GBZ‐ and S1‐mediated differences were statistically analyzed with one‐way ANOVAs followed by post hoc Dunnett's correction or with a Kruskal–Wallis test followed by post hoc Dunn's correction. *p < 0.05, **p < 0.01, ***p < 0.001, ****p < 0.0001. [Colour figure can be viewed at wileyonlinelibrary.com]