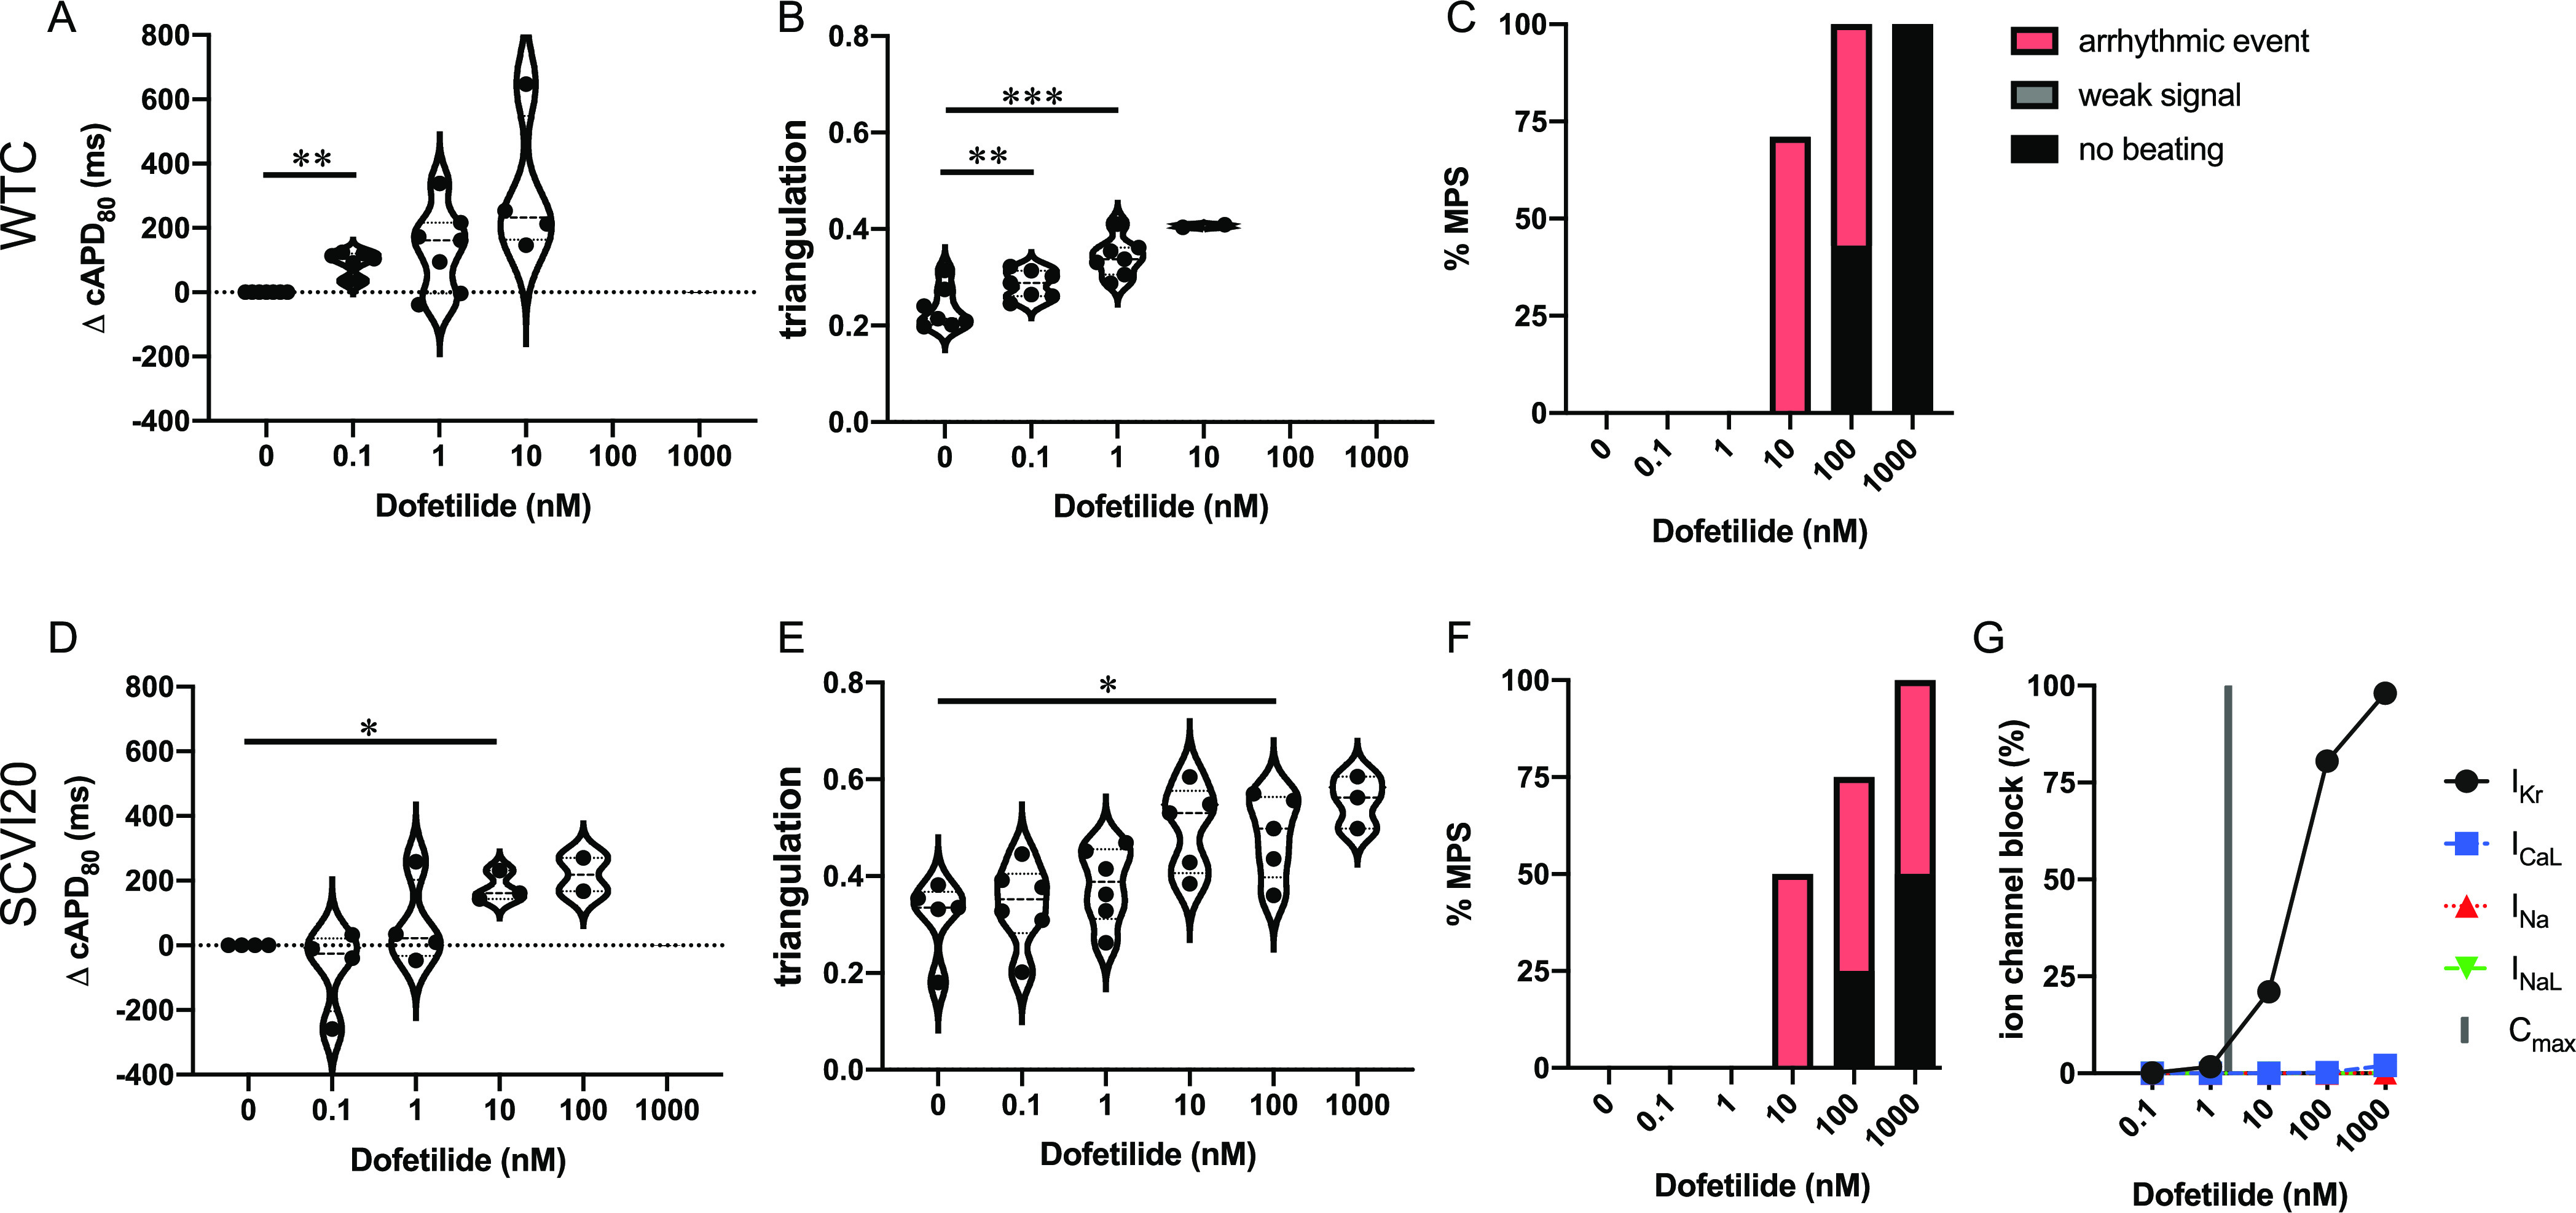
Figure 2.

Evaluation of pro-arrhythmic effects of the high-risk drug dofetilide. Results are shown for the MPS generated from the WTC cell line (A–C) and the SCVI20 cell line (D–F). Panels (A, D) show the dose-dependent change in action potential duration (corrected to 1 Hz beat rate). Panels (B, E) show the beat shape metric triangulation calculated as (APD80 – APD30)/APD80 for voltage traces. Panels (C, F) show the percentage of the MPS exhibiting arrhythmia-like event (red), weak signals (gray), or non-beating tissues (black), as defined in Figure 1. Spontaneous voltage and calcium traces were considered for this analysis. (G) Expected percent ion channel block determined from tested drug doses from the literature. Statistical analysis: mixed-effects analysis with the Geisser–Greenhouse correction followed by Dunnett’s multiple comparison test to dose 0. Replicates are from independent tissues. Reported significance levels are p < 0.05 (*), 0.01 (**), 0.001 (***), and 0.0001 (****).
