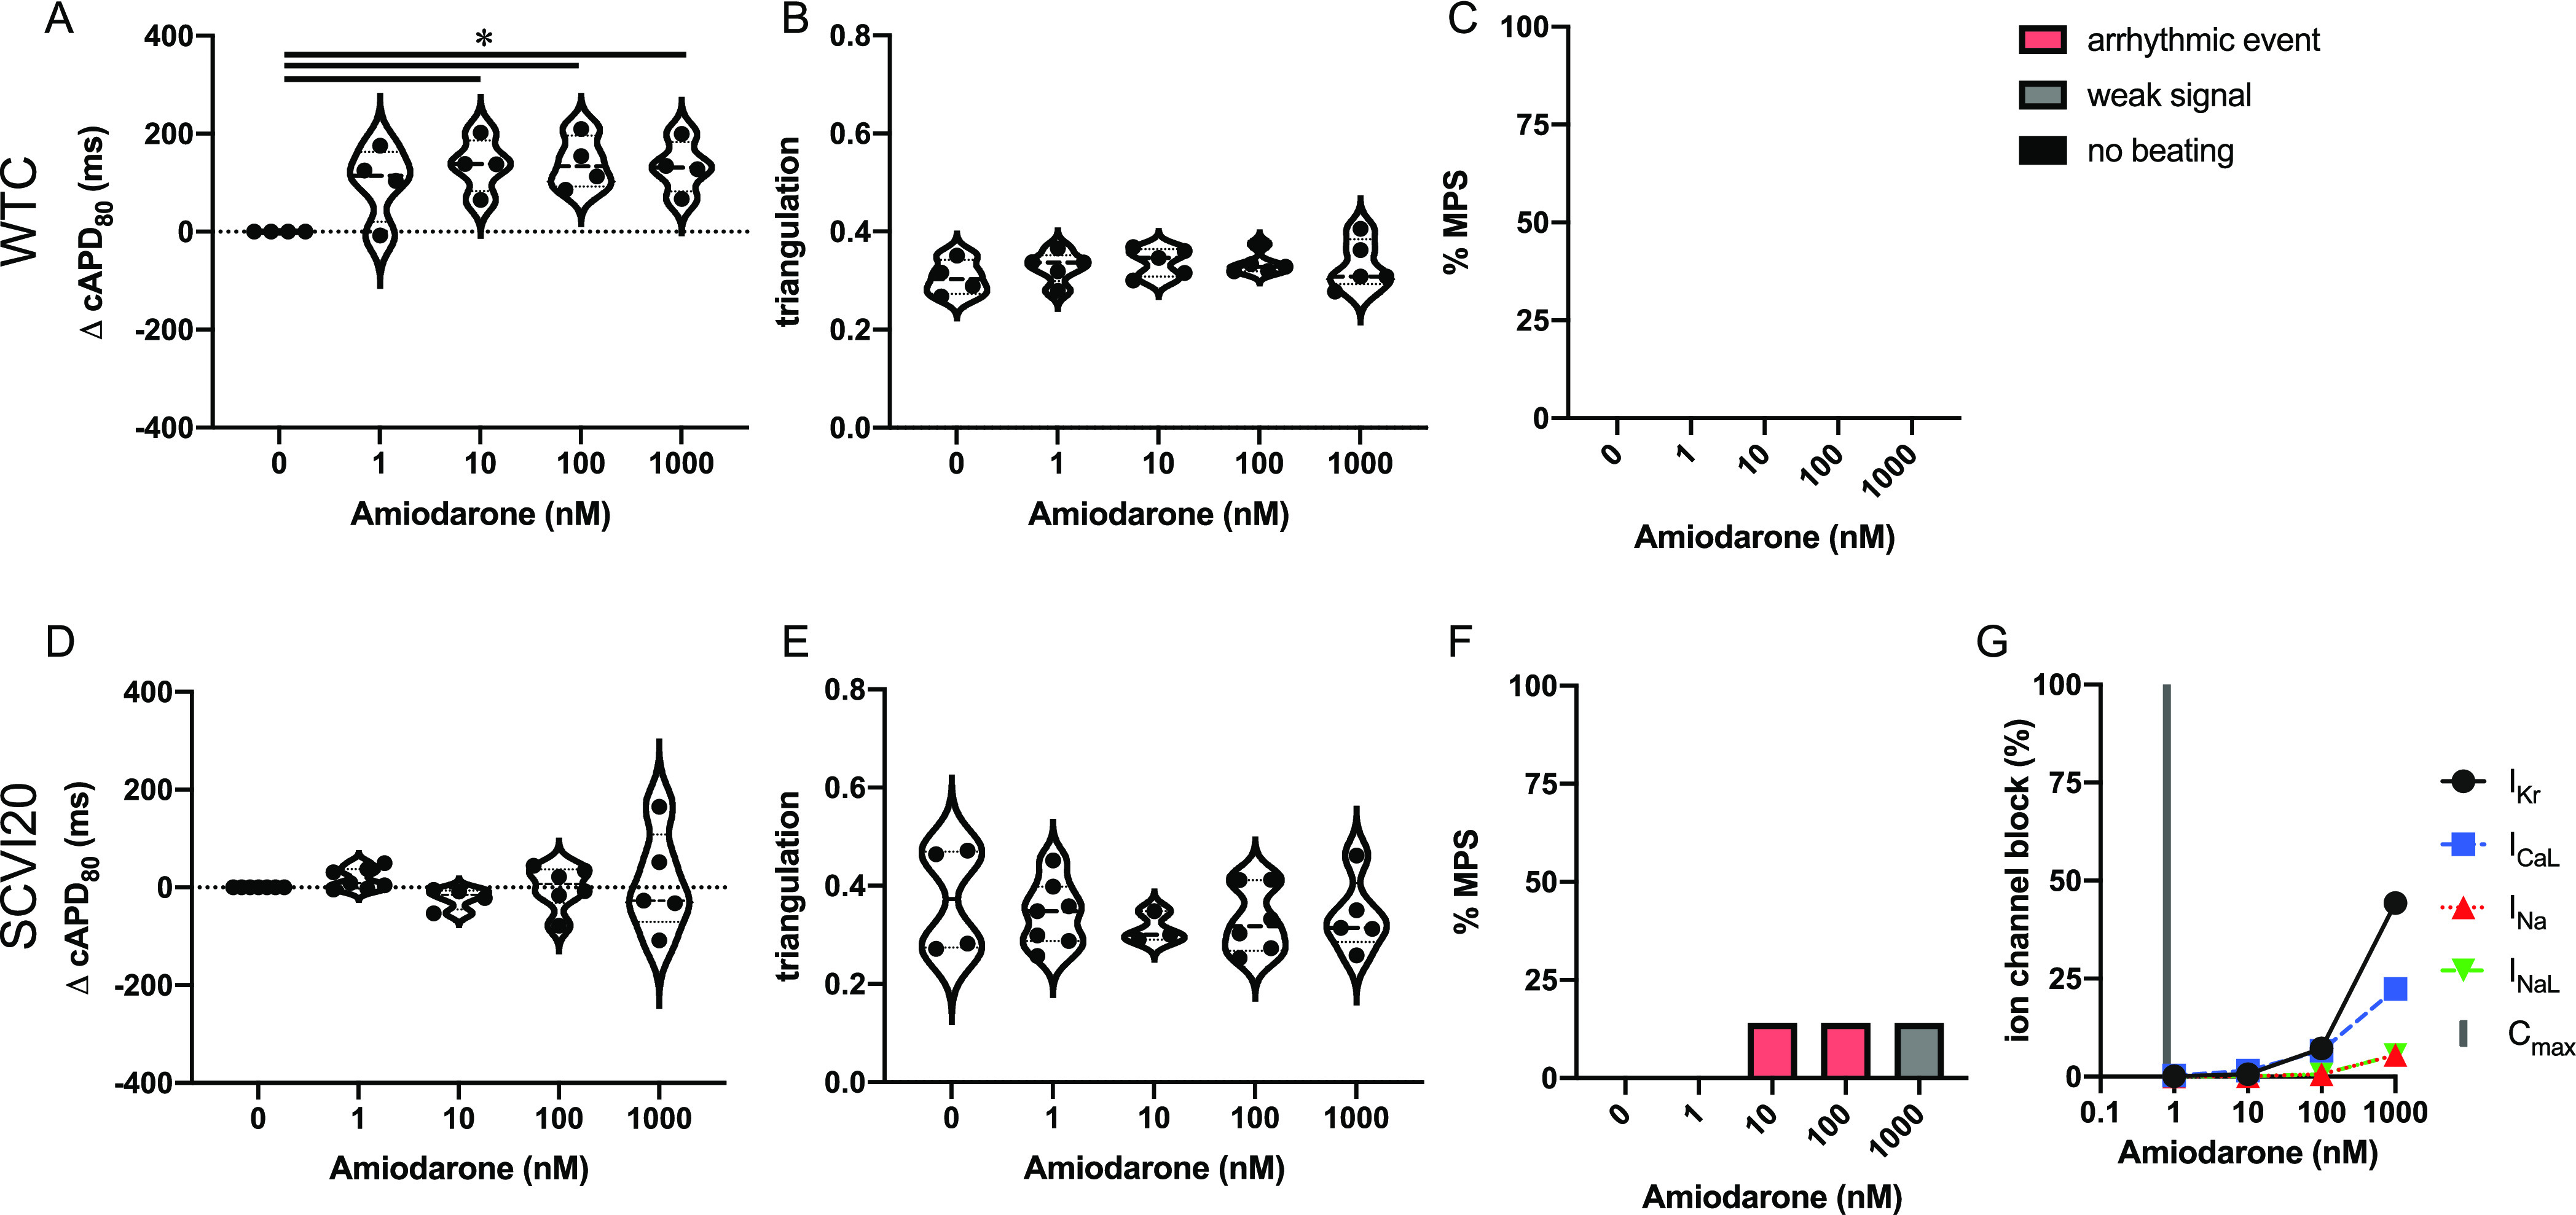
Figure 4.

Evaluation of pro-arrhythmic effects of the intermediate-risk drug amiodarone. Results are shown for the MPS generated from the WTC cell line (A–C) and the SCVI20 cell line (D–F). Panels (A, D) show the dose-dependent change in action potential duration (corrected to 1 Hz beat rate). Panels (B, E) show the beat shape metric triangulation calculated as (APD80 – APD30)/APD80 for voltage traces. Panels (C, F) show the percentage of the MPS exhibiting any sort of arrhythmia-like event (red), weak signals (gray), or non-beating tissues (black). Spontaneous voltage and calcium traces were considered for this analysis. (G) Expected percent ion channel block at tested drug doses based on literature values. Statistical analysis: mixed-effects analysis with the Geisser–Greenhouse correction followed by Dunnett’s multiple comparison test to dose 0. Replicates are from independent tissues. Reported significance levels are p < 0.05 (*), 0.01 (**), 0.001 (***), and 0.0001 (****).
