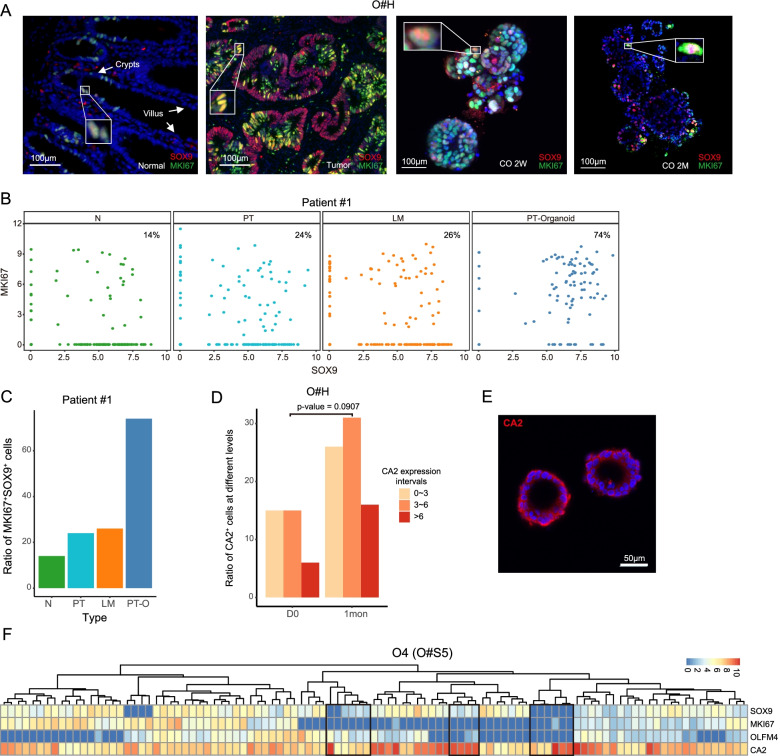
Fig. 2.
SOX9/MKI67-positive cells may have potential of self-renewal and differentiation. A Immunofluorescence staining of cell proliferation marker (MKI67) and intestinal stem/progenitor cell marker (SOX9) for adjacent normal tissue and tumor tissue in vivo as well as patient-derived cancer organoids that were cultured for 2 weeks and 2 months. CO: cancer organoid. 2W: 2 weeks. 2M: 2 months. Scale bar, 100 μm. B Dot plot showing the expression level of MKI67 and SOX9 of patient #1. Colors represent cells that collected from different regions. N, normal region. PT, primary tumor. LM, liver metastasis. PT organoid, in vitro cultured organoid that are derived from the primary tumor. The proportion of double positive cells is written in the upper-right corner of each dot plot. C Bar plot shows the ratio of SOX9/MKI67 double positive cells of patient #1 from different regions. N, normal tissue; PT, primary tumor; LM, liver metastasis; PT organoid, primary tumor-derived organoid. D The bar plot shows the ratio of cells that expressed different level of enterocyte marker CA2. D0 represents thawed tumor organoid, and 1mon represents tumor organoid that is cultured for 1 month. P-value was calculated through t-test. The color of the bar represents the expression levels (log2(TPM+1)) of CA2. E Immunofluorescence staining of enterocyte marker CA2 on long-term cultured tumor organoid (O#H). Scale bar, 50μm. F Heatmap shows cell-type specific genes expression in one of five tumor organoids of one patient (O#S5). Colors from blue to red represents expression level (log2(TPM+1)) from low to high. The black boxes highlight cells that do not express or low express stem/pluripotency markers (SOX9, OLFM4, LGR5, ALCAM, LRIG1, and MKI67) but highly express differentiated marker CA2

