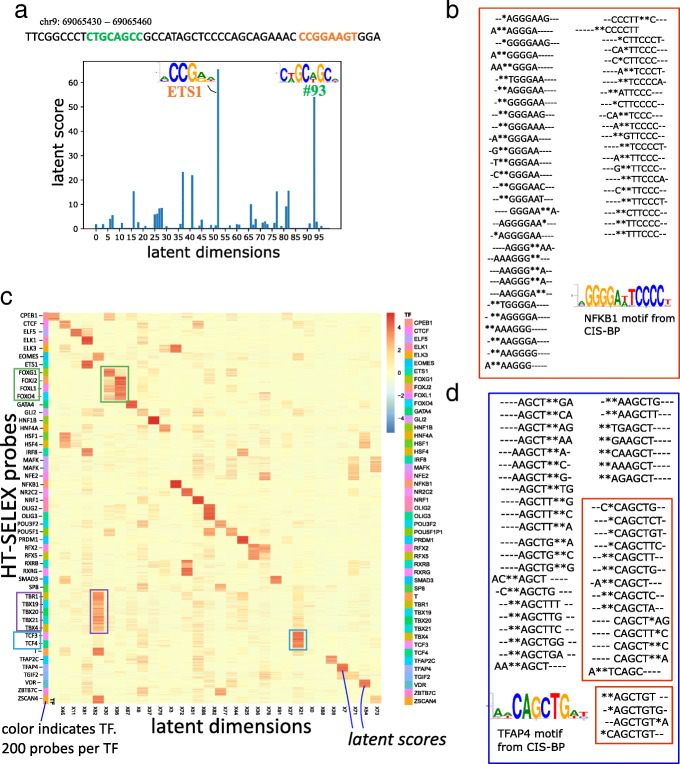
Fig. 2.
a TFs and the corresponding ‘latent scores’, assigned to a 30bp region of a random peak from our GM12878 dataset. b Heatmap of the latent space obtained by our model upon doing inference on ≈10,000 SELEX probes from 48 TF experiments. Each row is a SELEX probe, with the probes being colored by their TF. There are 200 probes per SELEX experiment. The green boxes highlight the FOX family of TFs and are showing the corresponding probes’ latent scores in dimension 96 (X96). c, d The top fifty 8-mers from two k-mer distributions learned by BindVAE are shown. These were obtained by sorting the decoder parameters encoding the k-mer distributions, namely for the following two topics/ dimensions m=72 and m=7. The 8-mers have been aligned using multiple sequence alignment and the ∗ symbols show the wildcards from our k-mer representation. In d, the 8-mers in the two red boxes correspond to roughly the prefix (top box) and suffix (bottom box) of the motif

