Fig. 3.
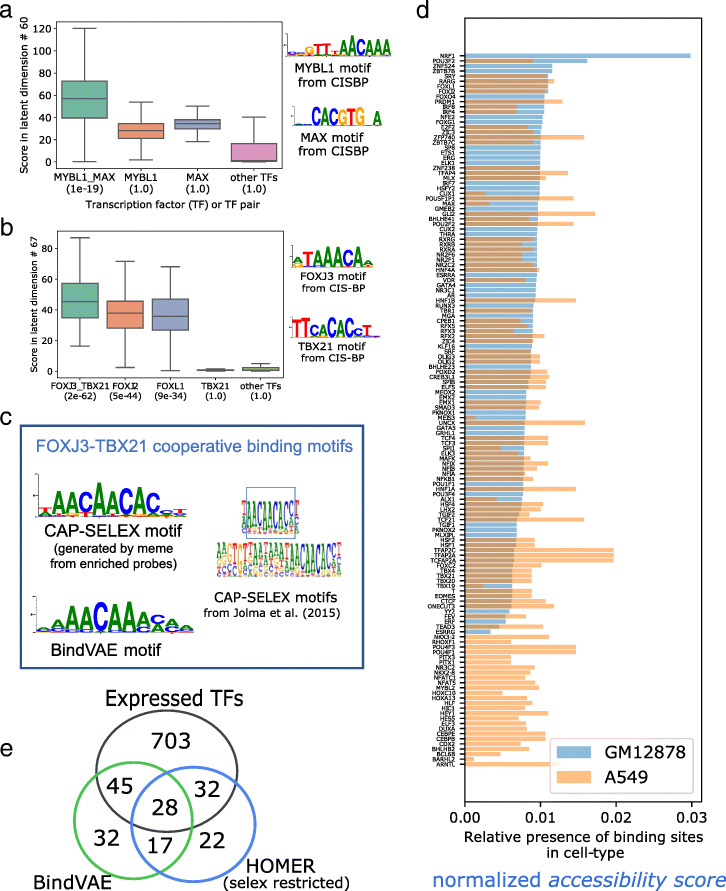
a, b Analysis of cooperative binding signals learned by the model trained on GM12878 peaks by scoring HT-SELEX probes from individual TFs and CAP-SELEX probes from pairs of TFs. The y-axis shows the distribution of latent scores of individual probes for the TF experiments shown on the x-axis. In the brackets below each TF label, we show the p-value of assigning to the latent dimension, that particular TF, using Algorithm 1. Cooperative binding motifs can be enriched while the individual TF motif may not be enriched, as seen for MYBL1, MAX in a and TBX21 in b that have a p-value of 1. cleft: CAP-SELEX based motif for the TF pair binding from Jolma et al. [20] and right: Motif learned by BindVAE for FOXJ3:TBX21 cooperative binding d TFs found in each cell type by our model and their ‘accessibility scores’ obtained by summing over all ATAC-seq peaks showing the possible extent of accessibility in the two cell lines: GM12878 (light blue) and A549 (orange). See text for details. e Venn diagram showing the overlap in the TFs found de novo by the VAE and HOMER in GM12878 and the extent of their overlap with all expressed genes. We show HOMER results run with the set of 296 motifs from Jolma et al. [18] (selex restricted) where HOMER only uses the TFs from our HT-SELEX set of 296 TFs

