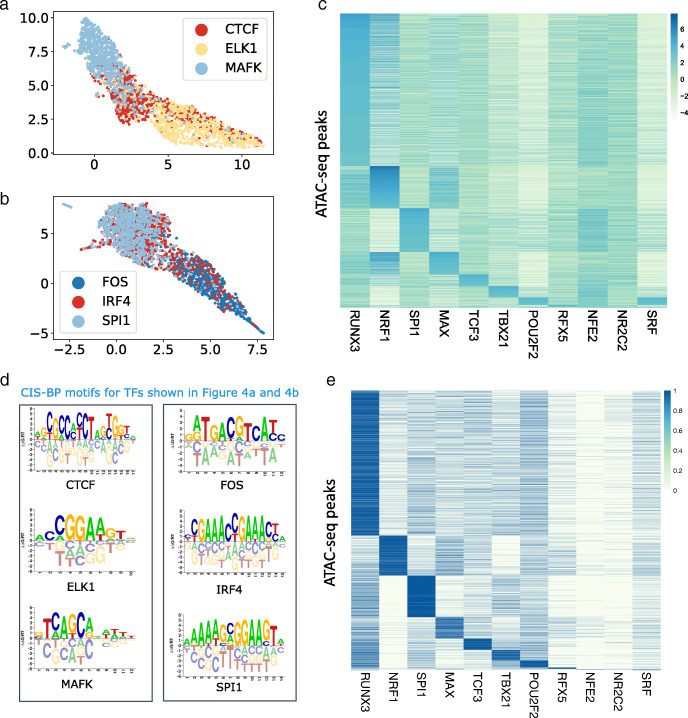
Fig. 4.
a UMAP projection of the latent representation for ChIP-seq peaks from CTCF, ELK1 and MAFKb UMAP projection of the latent representation for ChIP-seq peaks from FOS, IRF4 and SPI1. For each TF, 1000 peaks are shown. c Heatmap showing 38,496 ATAC-seq peaks from GM12878 cell line, that overlap with ChIP-seq peaks from 11 different TFs. For a TF t, the peaks have been sorted by the latent score of the dimension that was mapped to t by Algorithm 1 d CIS-BP motifs for TFs shown in a and b show distinct motifs for all TFs. e Matrix of GM12878 ATAC-seq peaks ordered as per the matrix ranked by latent factor scores (topic scores) from Figure 4c. Rows are peaks and columns are TFs. Each entry i,j in the i-th row and j-th column of the matrix is the i-th peak’s ChIP-seq annotation for TF j

