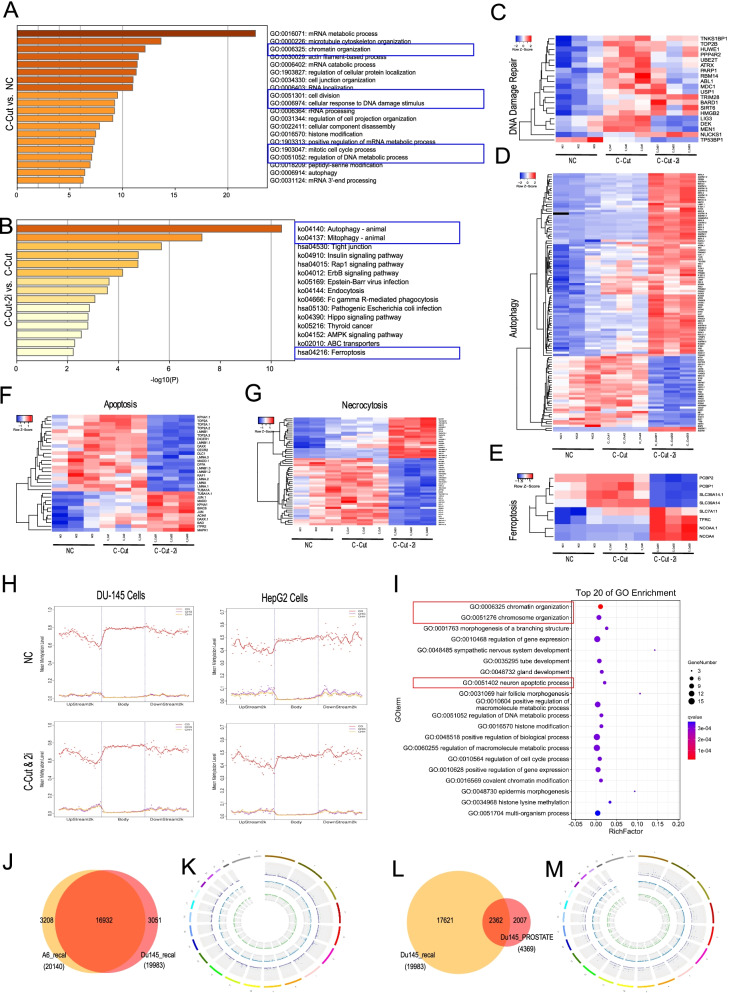
Fig. 2.
The molecular mechanism of the "i-CRISPR" strategy on cell killing. A, B Enrichment of GO terms for the proteins with upregulated phosphorylation between the C-Cut and NC groups (A), C-Cut-2i and C-Cut groups (B). Differentially phosphorylated proteins were tested by quantitative phosphoproteomics analysis using tandem mass spectrometry. NC: negative control, only treated with Cas9; C-Cut: CRISPR-Cut, treated with Cas9 and the 8 gRNAs in the T8-set; C-Cut-2i,CRISPR-Cut treated with the T8-set and 2i. C-G Heatmap shows the selected differentially phosphorylated proteins related to DNA damage repair (C), autophagy (D), ferroptosis (E), apoptosis (F), and necrocytosis (G) among the 3 groups. H Analyses of whole-genome DNA methylation patterns in body regions (body), upstream-2 k (− 2 k) regions and dowstream-2 k (2 k) regions of genes in control and treated HepG2 cells and DU145 cells. NC: negative control, only treated with Cas9; C-Cut&2i,CRISPR-Cut with 8gRNAs (for HepG2) or 7gRNAs(for DU145) and 2i (NU7441 and KU55933). I Enrichment of GO terms for the genes that have differentially methylated regions (DMRs) on C in both DU145 and HepG2(refer to Fig. S8C). J. Venn diagram shows the common and specific mutations in DU145 and A6 discovered by whole genome sequencing (WGS). A6 is a single-cell clone derived from DU145 that has been cultured alone for approximately 60 passages in our laboratory. K Circos plot showing the distribution of the common and specific mutations in DU145 and A6. Purple: common mutations in DU145 and A6; blue: specific mutations found only in A6; green: specific mutations found only in DU145. L Venn diagram shows the common and specific mutations in DU145 and DU145 public data. Public DU145 data are public DU145 mutation data (CCLE, https://depmap.org/portal/cell_line/ACH-000979?tab=mutation). M Circos plot showing the distribution of the common and specific mutations in DU145 and DU145 public data. Purple: common mutations in DU145 and DU145 public data; Blue: specific mutations found only in DU145; Green: specific mutations found only in DU145 public data

