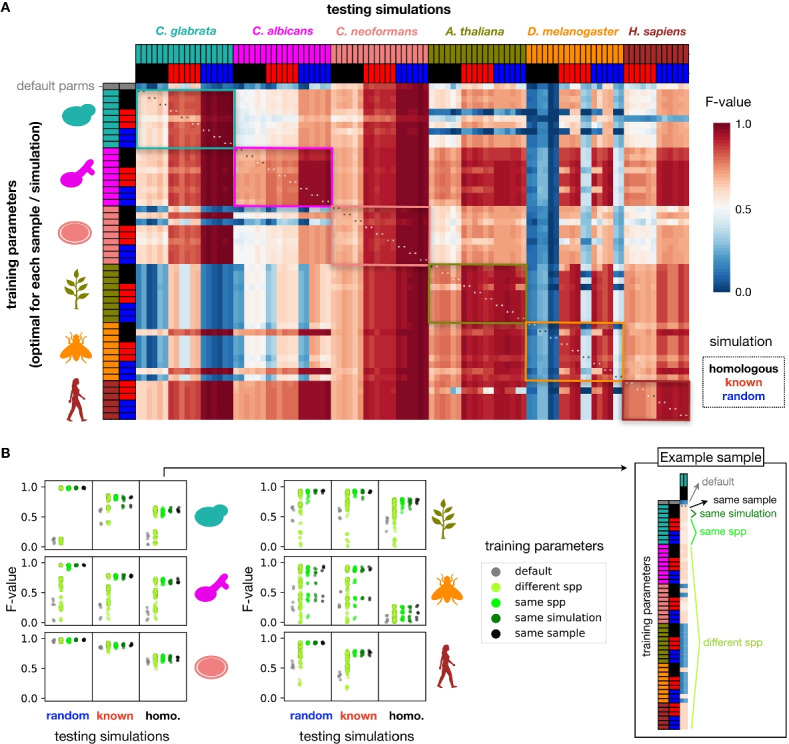
Fig. 3.

There is no universal recipe for SV calling across all species. A In order to assess whether perSVade’s parameter optimization is necessary for a given combination of sample and simulation (mentioned in Fig. 2), we measured the SV calling accuracy of each optimized parameter set on the other combinations. Each row indicates a different “training” parameter set optimized for each sample and simulation type in all species. In addition, the first row refers to the default parameters. Each column represents a simulation from a given sample / simulation type to be “tested.” The heatmap shows the F-value of each parameter set on each tested simulation (hereafter referred to as “testing instance”). Note that the species are ordered alike in rows and columns. In addition, note that each sample (from a given species and simulation type) yielded one set of training parameters and two simulated genomes tested here, which explains why there are two columns for each row. The colored boxes indicate testing instances where the training and testing species are equal. The asterisks refer to instances where both the sample and type of simulation are equal in the training and testing (equivalent to the “optimized” parameters from Fig. 2). Note that Additional file 1: Figure S6 shows the corresponding precision and recall, from which the F-value is calculated. B We summarized the data shown in A to compare how similar types of training parameters performed on each species (in the rows) and type of simulations (in the columns). Each point corresponds to a testing instance, matching one cell from the heatmap in A. The “default” and “same sample” reflect testing instances where the training parameters were either un-optimized or optimized specifically for each sample, respectively. The “different spp” group includes instances where the training parameters were from different species. The “same spp” group shows testing instances with both training parameters and tested simulations from a different sample of the same species. The “same simulation” reflects instances with the same training and testing sample, but different simulation types. For clarity, the right box shows how the training parameters are grouped for a set of “homologous” simulations based on one example C. glabrata sample (which corresponds to the first two columns in A)
