-
A, B
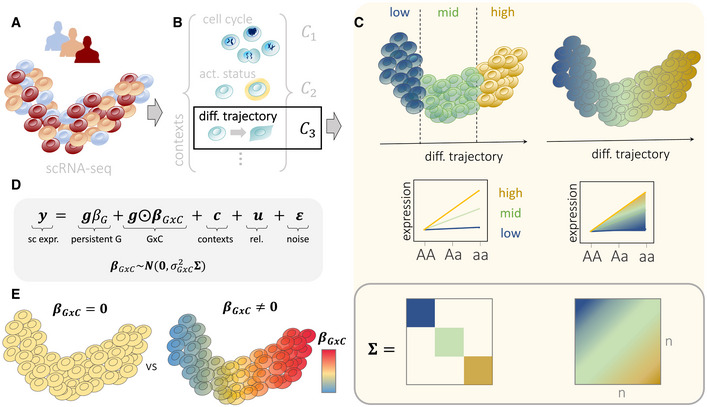
Established workflows based on principal component analysis or factor analysis applied to scRNA‐seq can be used to both estimate cellular manifolds (A) and to uncover individual factors that capture different cellular contexts (B). In addition to capturing major cell types, these factors can also explain subtle subtypes, as well as cell‐type independent variation, such as the cell cycle and other cell‐intrinsic factors. These cellular contexts can represent both discrete and continuous cell‐state transitions, including cellular differentiation.
-
C
Illustration of a genotype–context (GxC) interaction where genetic effects are modulated by a cellular differentiation context. Established analysis strategies (left) typically require discretization into discrete cell clusters (here low, mid, high), whereas CellRegMap enables assaying allelic effects as a function of the continuous differentiation context (right). Top panel: cellular manifold with color denoting allelic effects, either estimated in discrete cell populations (left) or in continuous fashion using CellRegMap (right). Middle panel: Alternative representation of allelic effects for different genotype groups, again either considering a discrete (left) or continuous modeling approach (right). Bottom panel: Encoding of discrete cell types (left) and continuous gradients using a cellular context covariance matrix in CellRegMap (right).
-
D
The CellRegMap model can be cast as a linear mixed model, where single‐cell gene expression values of a given gene are modeled as a function of a persistent genetic effect, GxC interactions, additive effects of cellular context, relatedness and residual noise. GxC interactions are modeled by treating allelic effect size estimates in individual cells () as random variable with prior covariance (C).
-
E
CellRegMap allows to test for heterogeneous genetic effects across cells due to GxC at a given locus for a given gene (testing vs. ). Color denotes the estimated GxC interaction component of genetic effects in individual cells ().

