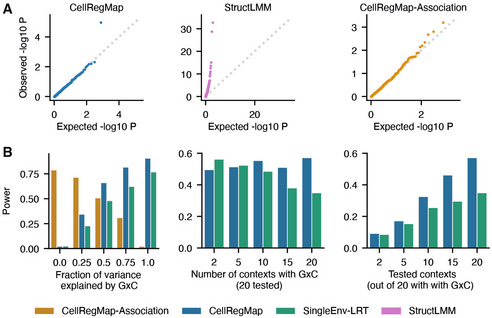
Figure 2. CellRegMap validation using simulated data.

-
ATest calibration under the null hypothesis (without any genetic effects). StructLMM, a model that does not account for the repeat structure in single‐cell sequencing data yields inflated test statistics. P‐values from CellRegMap and CellRegMap‐Association, a variant of CellRegMap for detecting persistent genetic effects only (Materials and Methods), follow the expected uniform distribution.
-
BPower at significance level α = 0.01 as a function of the fraction of genetic variance explained by GxC (left), the number of simulated contexts with GxC (middle) and the number of tested contexts (out of 20 all contributing to GxC, right). Compared are CellRegMap, CellRegMap‐Association (where applicable) and a fixed‐effect likelihood‐ratio‐test for single contexts (minimum P‐value across all contexts, Bonferroni‐adjusted for the number of tested contexts; Materials and Methods).
