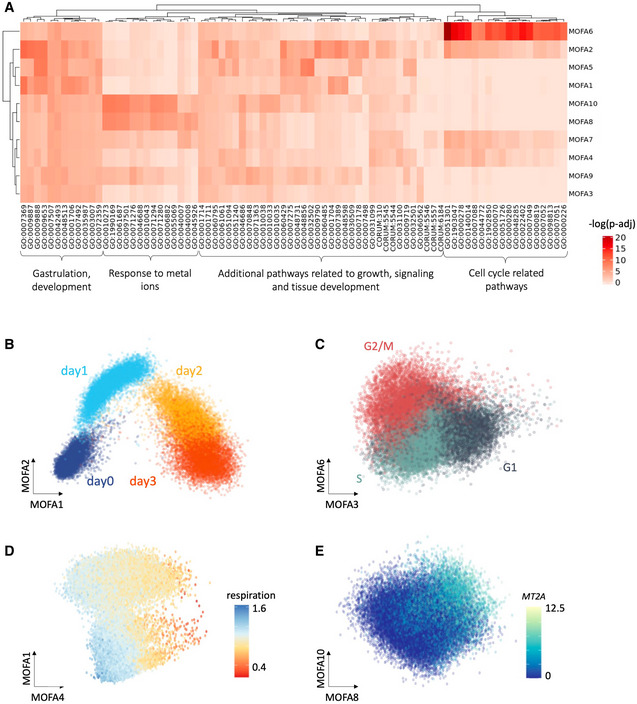
Figure EV2. Annotation of the MOFA factors from the endoderm differentiation study.

Data ref: Cuomo et al (2020b).
-
AHeatmap displaying negative log P‐values from GO enrichment analyses based on the absolute values of the loadings of individual MOFA factors (Materials and Methods).
-
BScatter plot of MOFA factors 1 & 2, with color corresponding to the time point of collection (day 0,1,2 & 3 of endoderm differentiation).
-
CScatter plot of MOFA factors 3 & 6, colored by estimated cell cycle phase (G1, G2/M, S; estimated using Seurat).
-
DScatter plot of MOFA factors 1 & 4 capturing respiration.
-
EScatter plot of MOFA factors 8 & 10, capturing a signature linked to response to metal ions, colored by expression of gene with top loadings, MT2A (Materials and Methods). Note that the scatter plots of MOFA factors in panels (B, C and D) are reused as reference in Fig 3.
