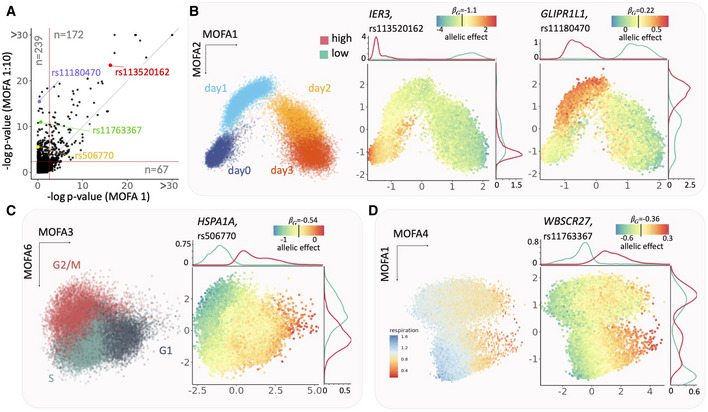
Representative examples of eQTL with GxC interaction. (B) Left: scatter plot of the first two MOFA factors (capturing cell differentiation as context) with color denoting the time point of collection (days 0, 1, 2 and 3 of endoderm differentiation); middle: identical scatter plot with color encoding the estimated allelic effect for the eQTL variant rs113520162 for the gene
IER3; right: allelic effect for the eQTL at rs11180470 for the gene
GLIPR1L1. Shown are total allelic effects (
) for individual cells. The allelic effect size color bar is centered on the persistent genetic effect (
). Panels on the top and right display marginal densities of cells that have either increased (high, red) or decreased (low, cyan) allelic effects (corresponding to the bottom and top 10% quantiles, respectively). Whereas the GxC effect for the eQTL for
IER3 is primarily explained by the first MOFA component, the GxC effect for
GLIPR1L1 is captured by the combination of the first two MOFA factors. (C) Analogous presentation as in (B), displaying a scatter plot between MOFA factors 3 and 6 with cells colored by alternative annotations. Left: inferred cell cycle phase (
Materials and Methods); Right: allelic effects for an eQTL at rs506770 for
HSPA1A (yellow). (D) As in (B, C) scatter plot of MOFA factors 4 and 1. Left: cells colored by cellular respiration (
Materials and Methods); Right: allelic effects for the eQTL at rs11763367 for
WBSCR27 (green).

