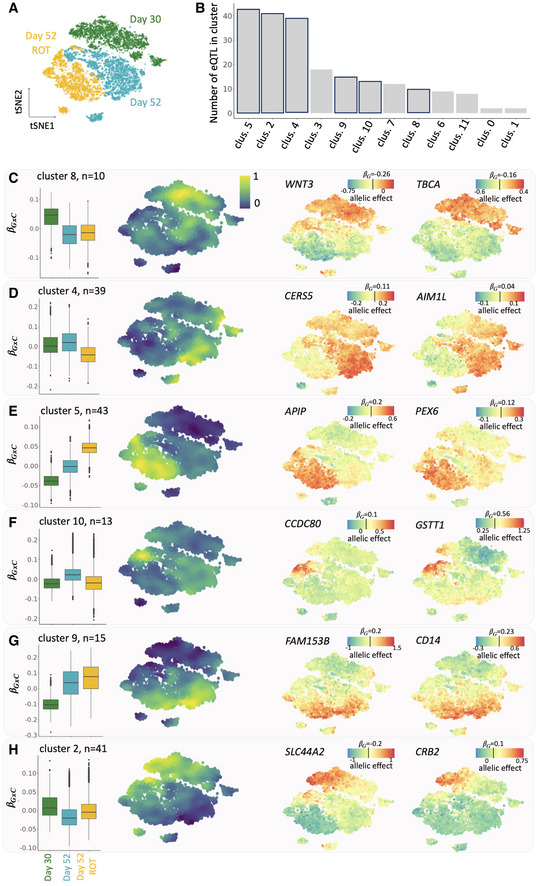
Figure 4. CellRegMap identifies fine‐grained regulatory modules in dopaminergic neurons.

-
AOverview of the cell subpopulations: tSNE plot of 8,648 pseudocells (Materials and Methods), highlighting three major populations of dopaminergic neurons: young neurons (day 30 of iPSC differentiation), more mature neurons (day 52) and rotenone‐treated day 52 dopaminergic neurons (day 52 ROT).
-
B–HResults from clustering of GxC allelic effect size estimates of individual cells for different genes. (B) Barplots indicating the number of eQTL with GxC effects assigned to each of 12 clusters. Highlighted are the six representative clusters that are displayed in subsequent panels. (C–H) For each of 6 representative clusters, from left to right: box plot of the distribution of the relative GxC effect sizes estimates for cells in each of the three major cell populations (as in A), manifold of consensus relative GxC effect sizes estimates for each cluster (A); example eQTL with allelic effect size estimates across the cell manifold as in a with color denoting total allelic effects (); the color bar is centered on the persistent genetic effect size estimate for each eQTL (). For box plots, central bands represent median values, upper and lower box limits represent the 25% and 75% quantiles, and whiskers correspond to minimum and maximum values.
