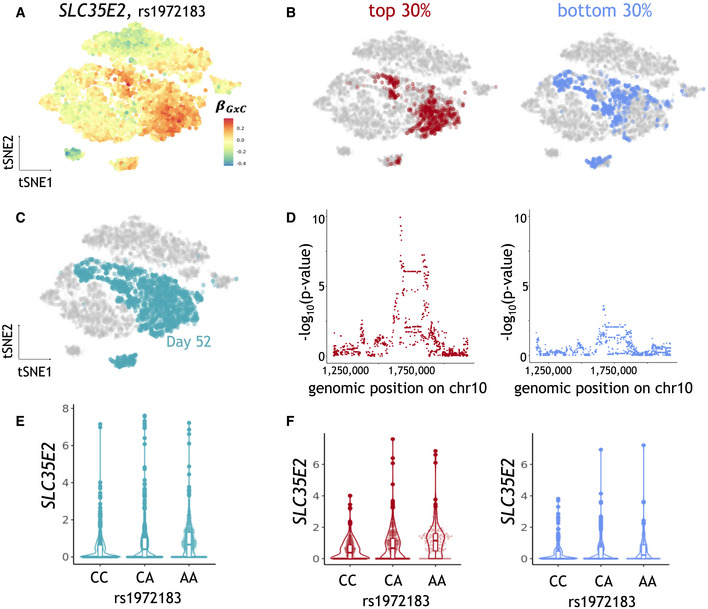
SLC35E2‐eQTL results obtained from a conventional eQTL mapping workflow (
Materials and Methods), using the CellRegMap output to select alternative cell populations to estimate expression phenotypes. (B, C) tSNE plots as in a, with color indicating alternative selected subpopulations of day 52 untreated cells. (B) Top and bottom 30% quantiles of day 52 untreated cells ranked by the absolute GxC allelic effect. (C) Day 52 untreated cells. (D) Manhattan plots displaying negative log
P‐values from a conventional eQTL workflow when using the subpopulations as in b to estimate expression phenotypes. Shown are negative log
P‐values (
y‐axis) as a function of the genomic position of common variants (
x‐axis). (E, F) Violone plots displaying effect size estimates on
SLC35E2 (
y‐axis) stratified by genotype at the lead variant rs1972183 (
x‐axis), either considering all cells for pseudo bulk expression estimation (E) or (F) considering the subpopulations as in (B, D).

