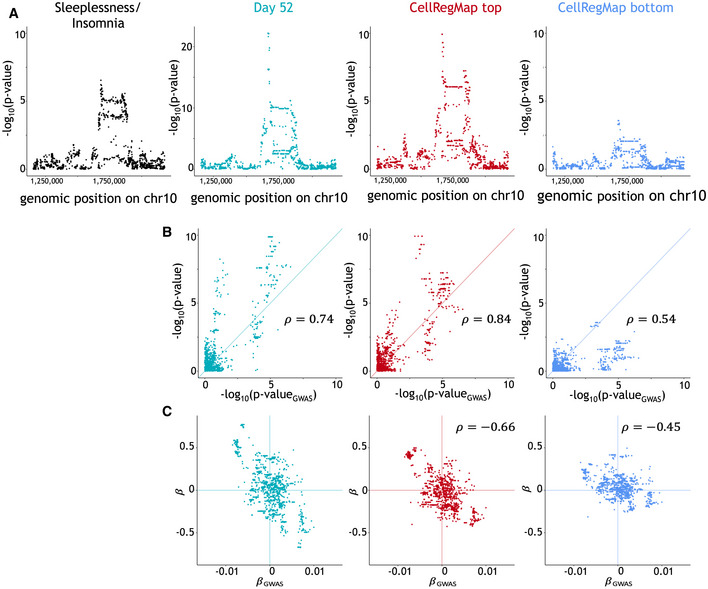
GxC profile at rs1972183 for
SLC35E2 identifies cellular population linked to GWAS variant for insomnia/sleeplessness. Data ref: Jerber
et al (
2021b), when considering cells identified as dopaminergic neurons only (
Materials and Methods). Columns represent all cells at day 52 (aqua), cell population that CellRegMap identifies to have strongest effects (red, top 30% quantile from
) and weakest (blue, bottom 30% quantile).
-
A
Manhattan plots for the relevant genomic region. From left to right: GWAS for Sleeplessness Insomnia, eQTL using aggregate expression estimates across all day 52 (untreated), eQTL Manhattan plot when considering day 52 cells in the top quantile, eQTL Manhattan plot when considering day 52 cells in the bottom quantile. Note that the latter two Manhattan plots for the top and bottom quantiles using CellRegMap are reused in Fig
5D.
-
B, C
Comparison between GWAS signal and eQTL signal, considering alternative traits based on the cell populations as in (A). (B) Scatter plots of negative log P‐values from GWAS (x‐axis) versus eQTL (y‐axis). (C) As in (B), displaying effect size estimates.

