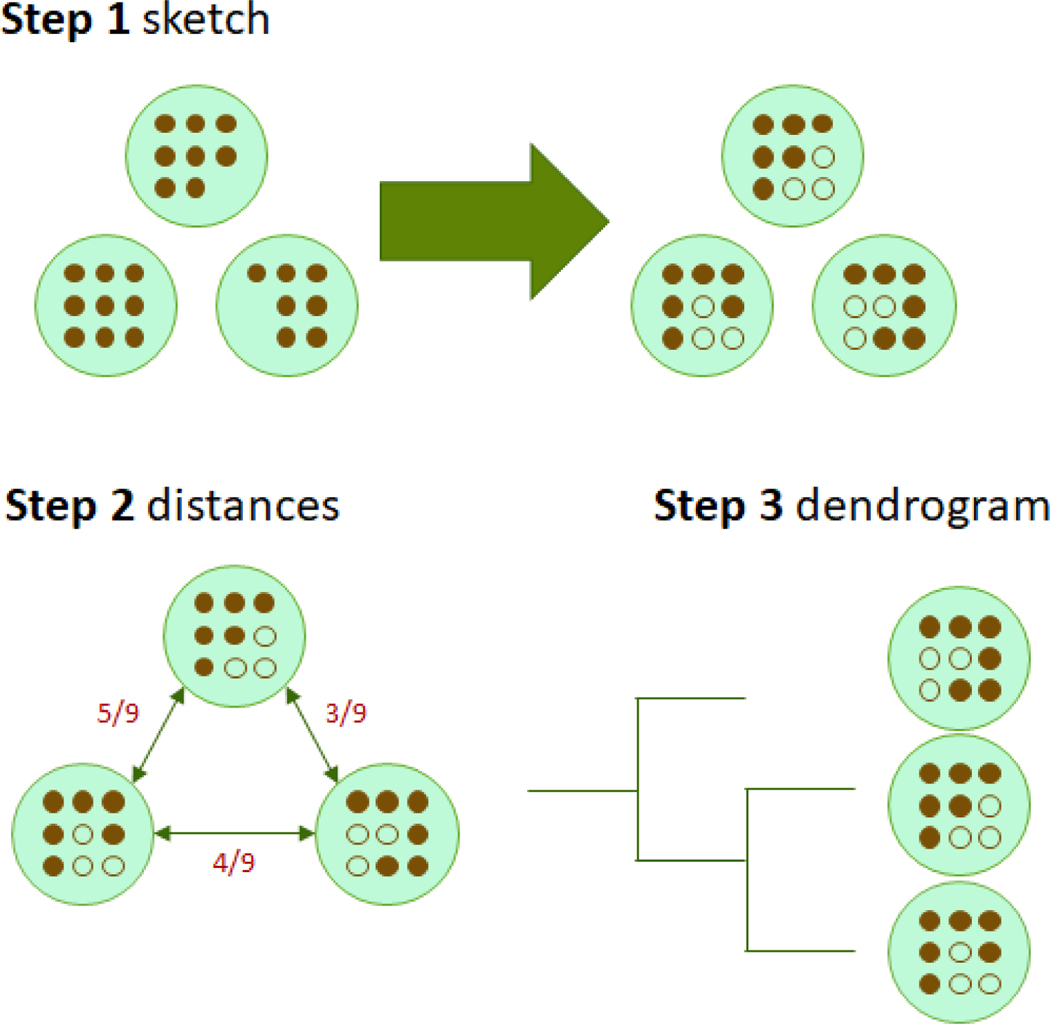
Figure 1:
The Mashtree workflow. Step 1) Sketch genomes with Mash. In this schematic, there is a green circle representing each genome in the analysis. Filled-in brown circles indicate the presence of a kmer. Missing circles represent true absence. After hashing with a sketch size of six (after the arrow), some kmers are not represented in the Mash sketch either because they are not present in the original genome or because only a finite number of kmers are sketched (e.g., six in this example). Henceforth, truly missing hashes or hashes not included in the Mash sketch are represented by empty circles. Step 2) Calculate distances with Mash dist. Distances in the figure are represented by Jaccard distances, which are calculated as the intersection divided by the union. In this example, the genomes are separated by Jaccard distances of 5/9, 4/9, and 3/9. These Jaccard distances are internally transformed into Mash distances (Ondov et al., 2016). Step 3) Create dendrogram with Quicktree using the Mash distance matrix.

