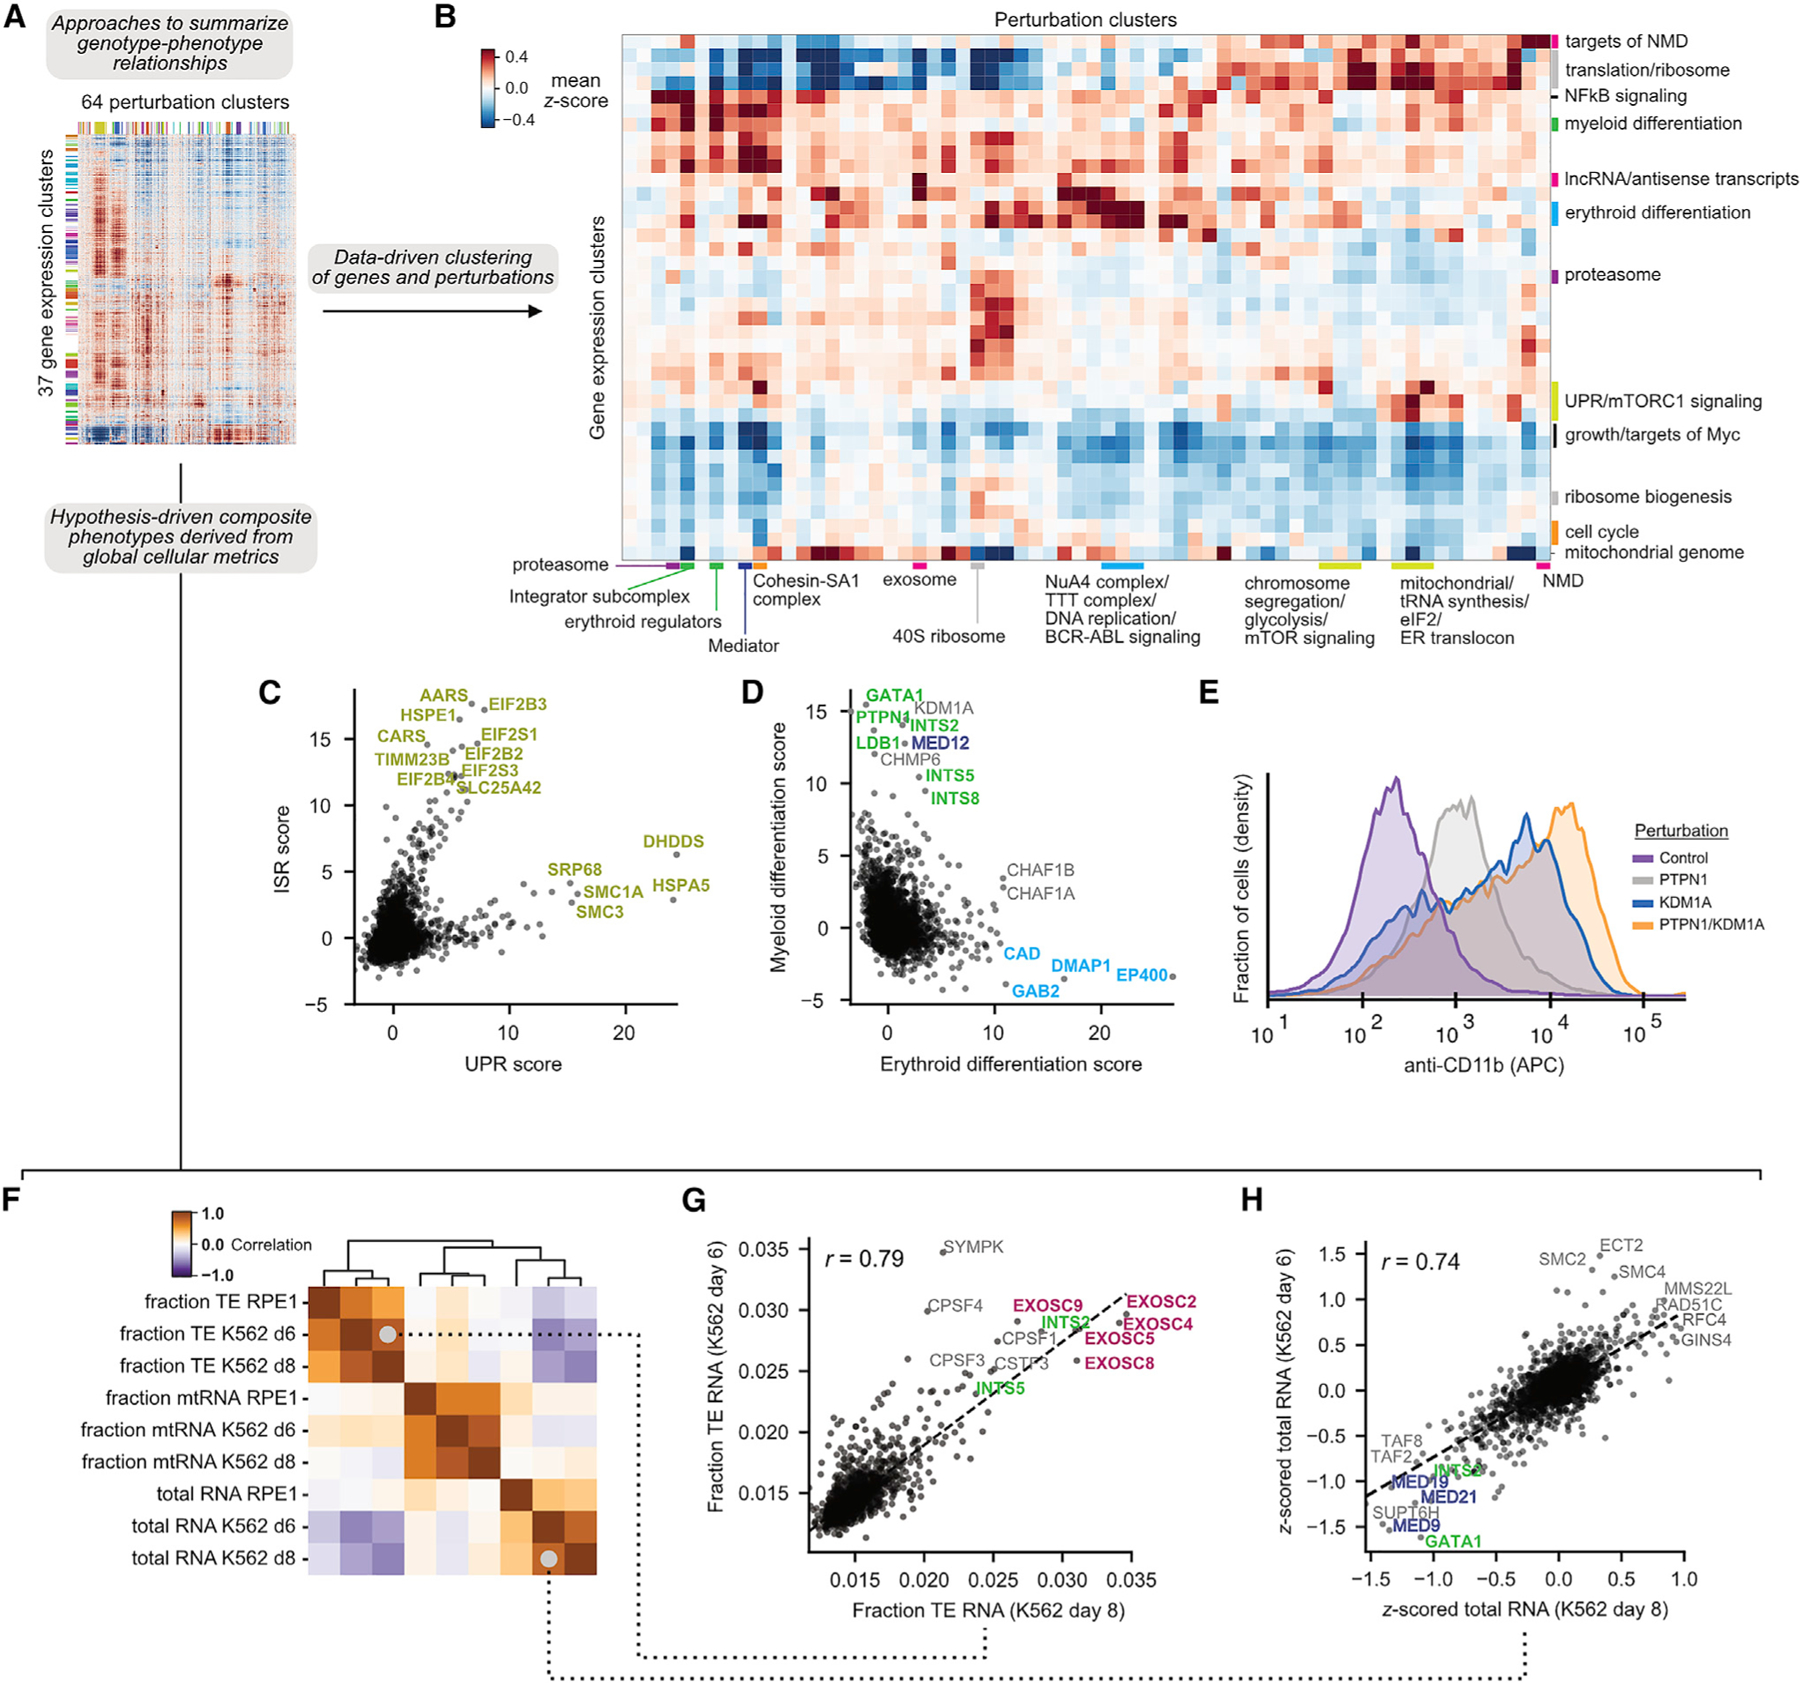
Figure 4. Summarizing genotype-phenotype relationships with Perturb-seq.

(A) Analysis schematic.
(B) Heatmap of the genotype-phenotype map. The heatmap represents the mean Z scored expression for gene expression and perturbation clusters labeled with manual annotations.
(C) Comparison of ISR and UPR scores for perturbations.
(D) Comparison of erythroid and myeloid differentiation scores for genetic perturbations. Genetic perturbations are colored to reflect cluster identity.
(E) CD11b surface expression (measured by flow cytometry) upon knockdown of PTPN1 or KDM1A in K562 cells.
(F) Correlation of composite phenotypes across time points and cell types. Fraction TE represents the number of non-intronic reads mapped to TEs over total, averaged over all cells bearing each perturbation. Fraction mtRNA represents the mean number of reads mapped to mitochondrial genome protein-coding genes over total. Total RNA represents the mean total RNA content.
(G) Comparison of TE expression across time points.
(H) Comparison of total RNA content across time points.
See also Figure S5.
