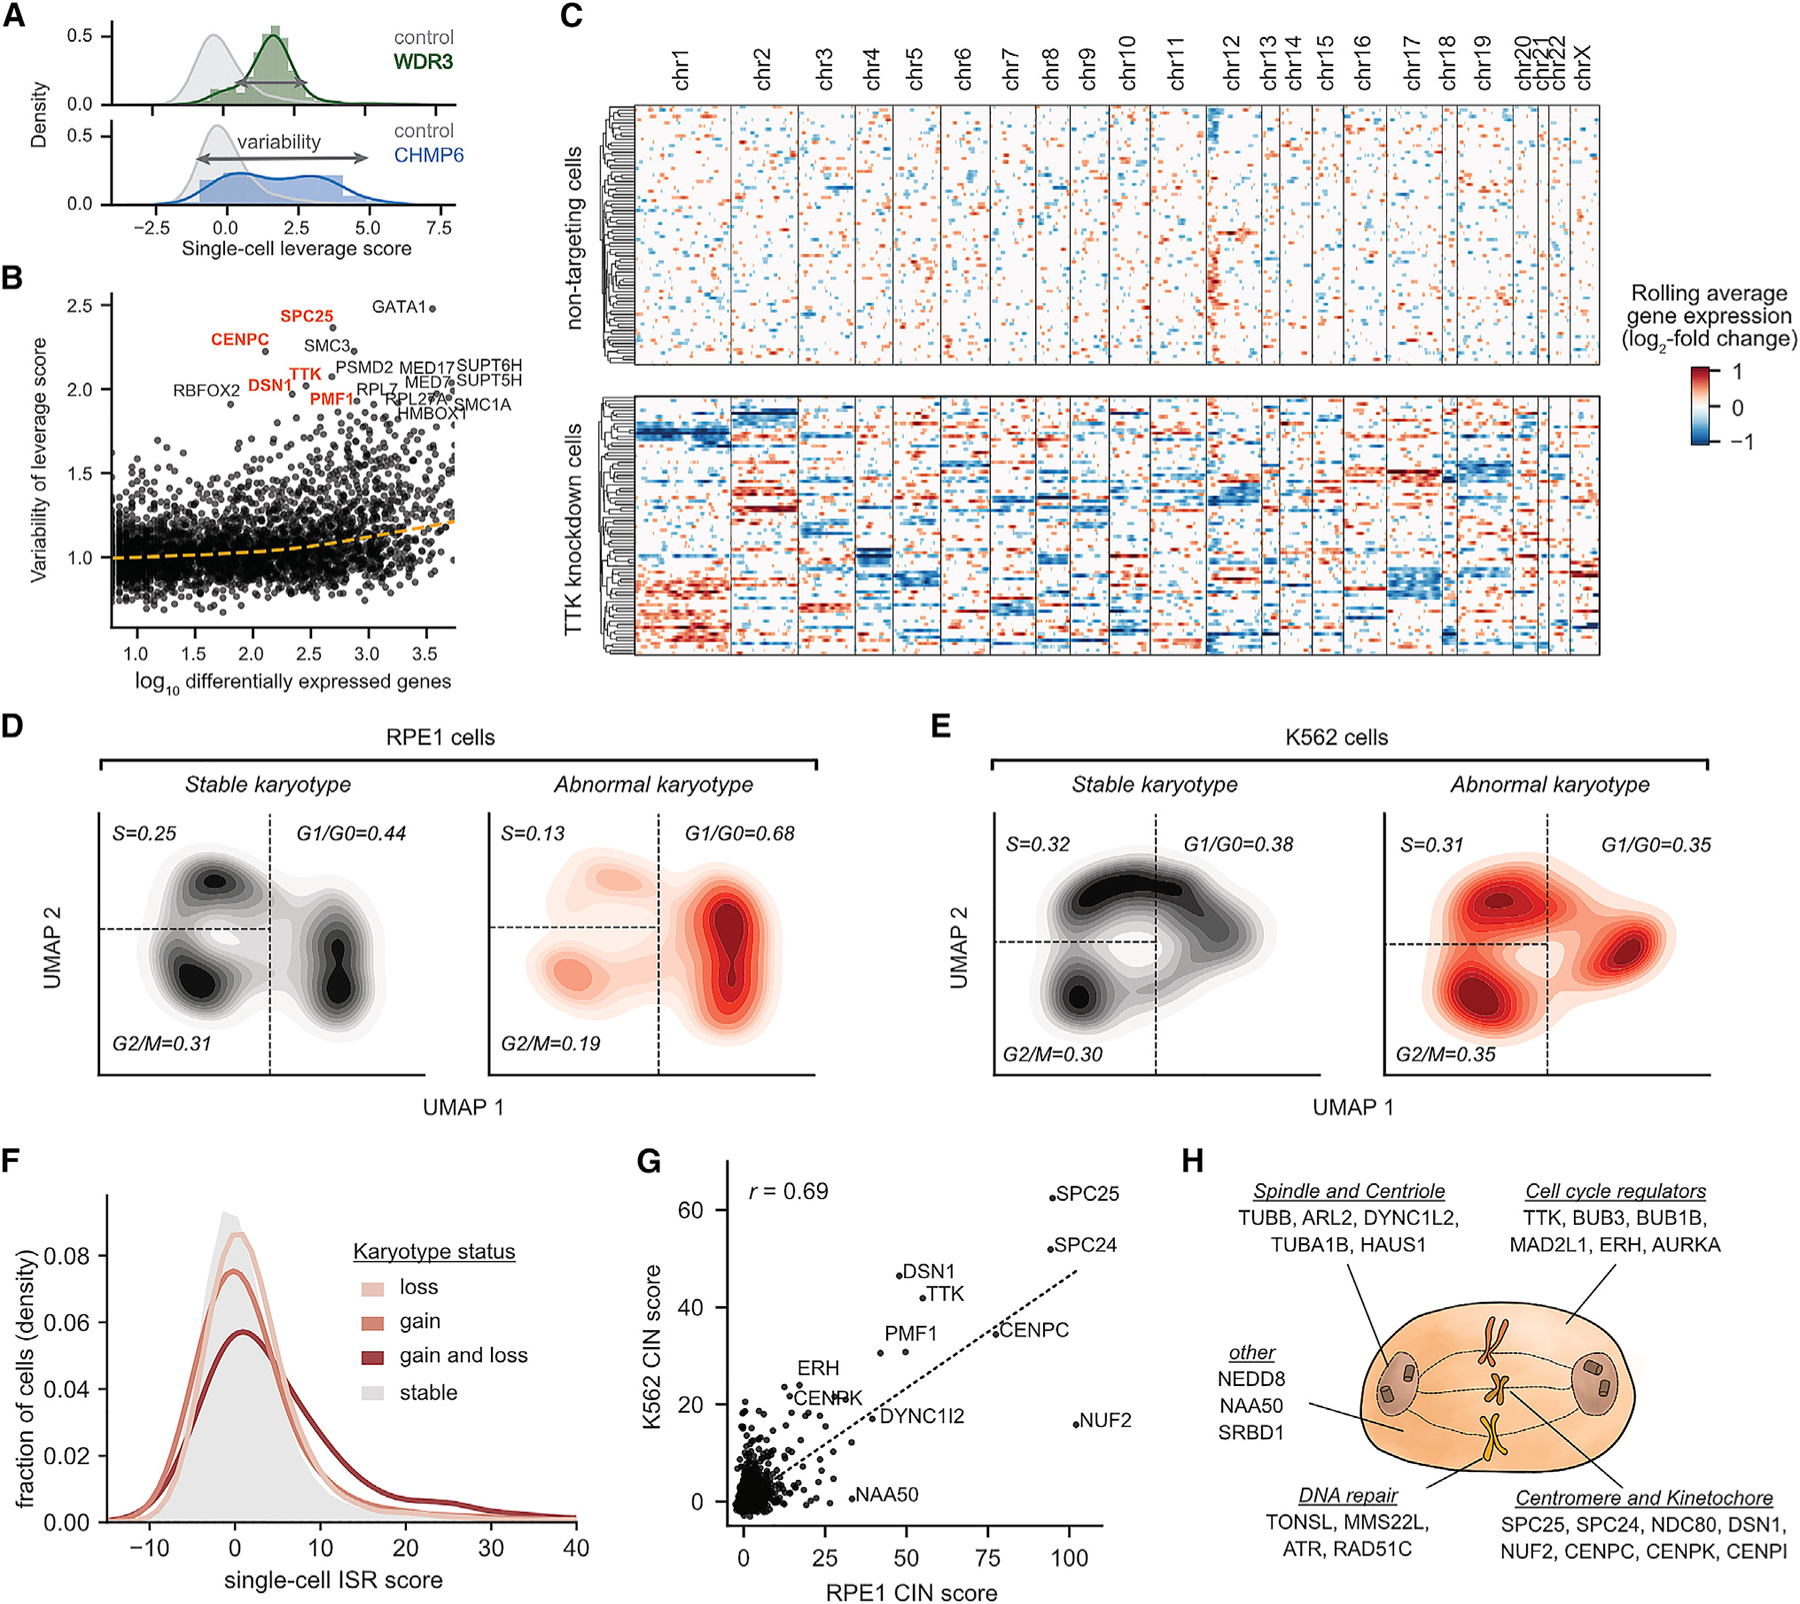
Figure 5. Exploring acute consequences and genetic drivers of aneuploidy in single cells.

(A) Schematic of heterogeneity statistic. Single-cell leverage scores quantify how outlying each cell is relative to control cells with single-cell heterogeneity quantified as the standard deviation of leverage scores.
(B) Identifying heterogeneous perturbations by comparison of single-cell heterogeneity to number of differentially expressed genes.
(C) Heatmap of chromosome copy-number inference from Perturb-seq data. For expressed genes, the log-fold change in expression is calculated with respect to the average of control cells, and genes are ordered along the genome. A weighted moving average is used infer copy-number changes (columns) in single cells (rows). Cells are ordered by hierarchical clustering based on correlation of chromosome copy-number profiles.
(D and E) Comparison of cell-cycle occupancy upon acute karyotypic changes. Abnormal karyotypic cells were defined as having ≥1 chromosome with evidence of changes in chromosome copy number for >80% of the chromosome length. Cell-cycle occupancy is shown as a 2D KDE of a random subset of 1,000 cells per karyotypic status.
(F) Comparison of CIN status on ISR score in RPE1 cells.
(G) Comparison of the effect of genetic perturbations on the CIN score across cell types. The perturbation CIN score is calculated as the mean single-cell sum of squared CIN values, z-normalized relative to control perturbations.
(H) Schematic of a subset of genetic perturbations that drive CIN.
See also Figures S6 and S7.
