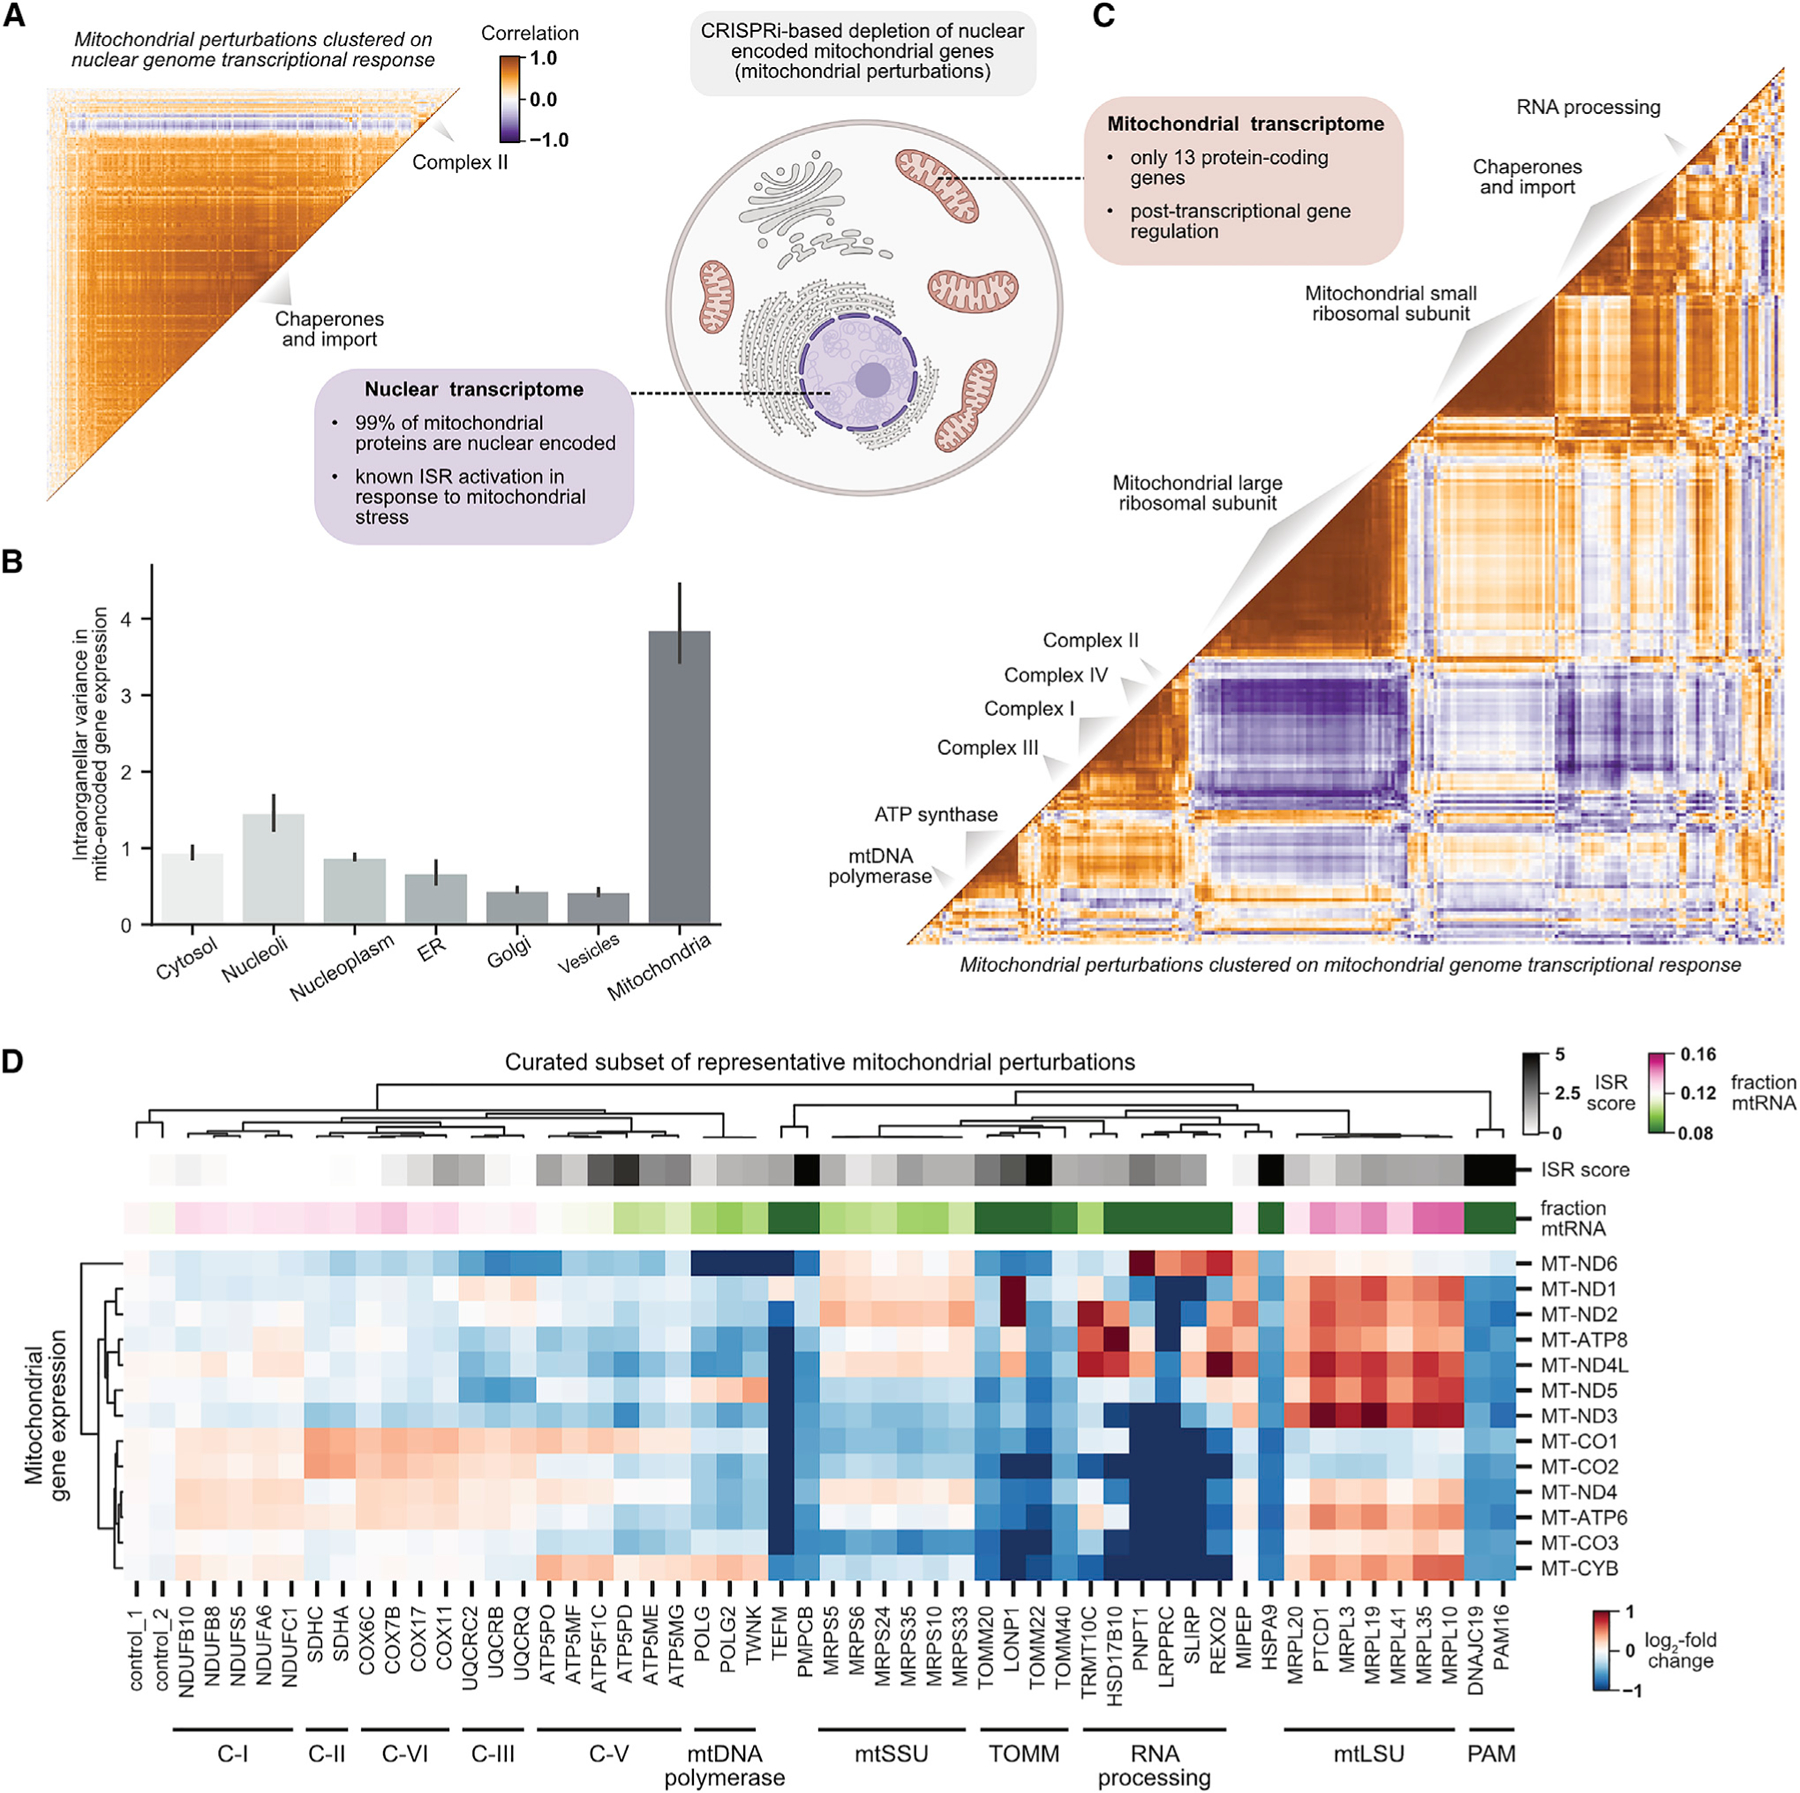
Figure 6. Global organization of the transcriptional response to mitochondrial stress.

(A) Clustering perturbations of nuclear-encoded genes whose protein products are targeted to mitochondria (mitochondrial perturbations) by nuclear transcriptional response. Mitochondrial perturbations were annotated by MitoCarta3.0 and subset to those with a strong transcriptional phenotype (n = 268). The heatmap displays the Pearson correlation between mean normalized gene expression profiles of mitochondrial perturbations in K562 cells clustered by HDBSCAN.
(B) Variability in the mitochondrial transcriptome by perturbation localization. For each of the 13 mitochondrially encoded genes, the variance in mean normalized expression profiles was calculated between all perturbations with the same localization (in the Human Protein Atlas). Barplots represent the average across genes with 95% confidence interval obtained by bootstrapping.
(C) Clustering mitochondrial perturbations by mitochondrial transcriptional response. Mitochondrial perturbations were defined as in (A). Gene expression profiles were restricted to the 13 mitochondrial-encoded genes. Heatmap is displayed and clustered as in (A). Clusters were manually annotated.
(D) Heatmap visualizing the mitochondrial genome transcriptional response to diverse mitochondrial stressors. The expression of the 13 mitochondrially encoded genes (relative to controls) is shown for a subset of representative mitochondrial perturbations.
See also Figure S8.
