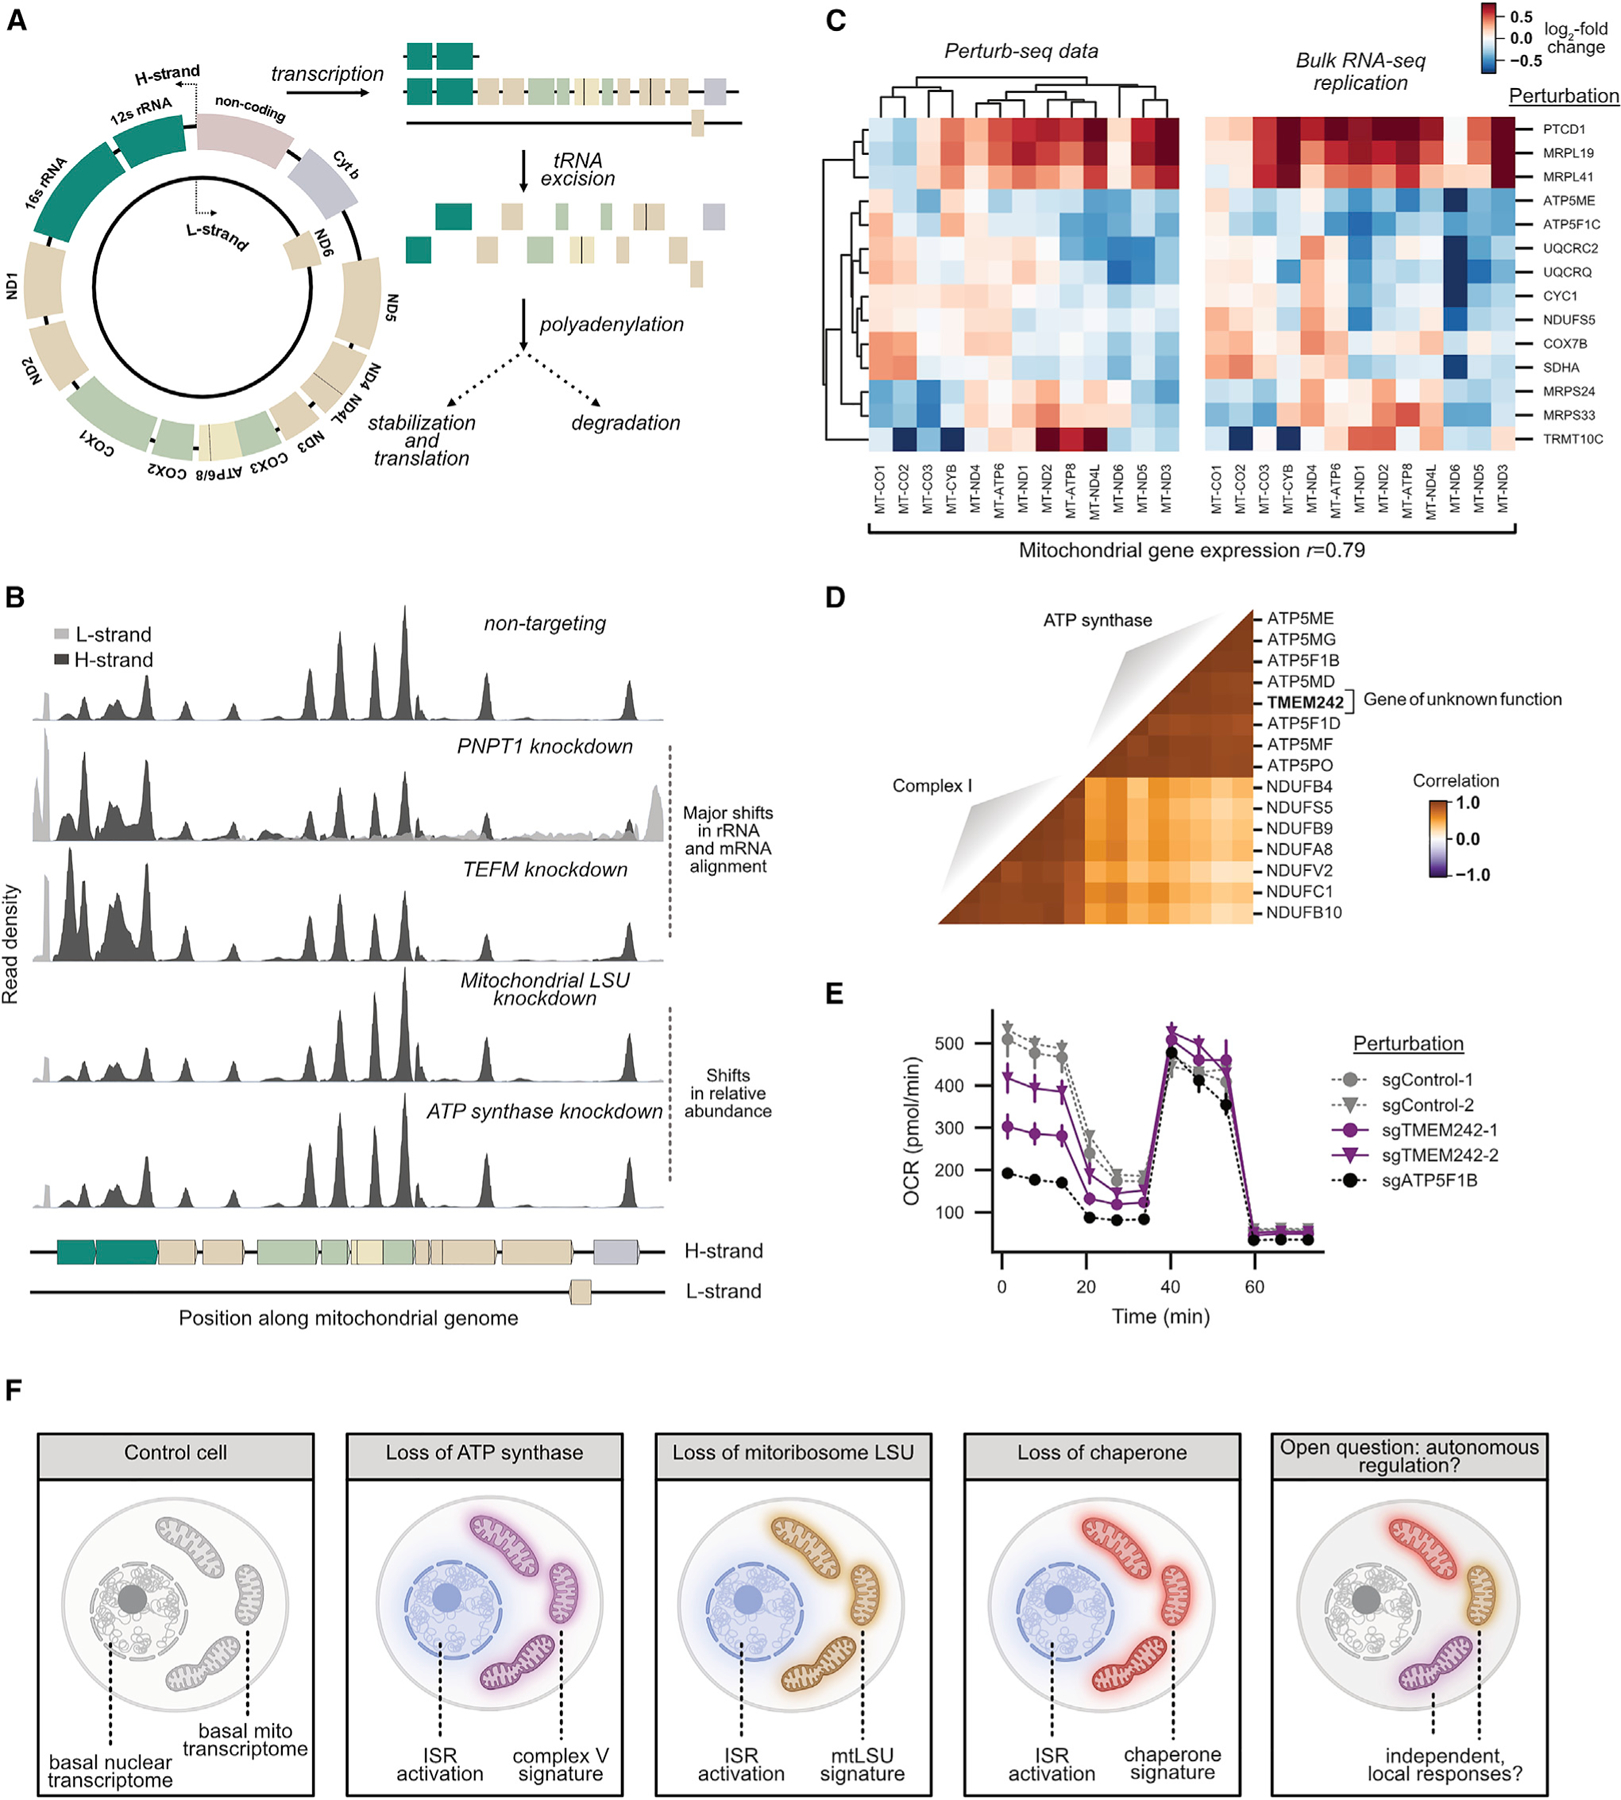
Figure 7. Investigating regulation of the mitochondrial genome in stress.

(A) Mitochondrial transcriptome schematic.
(B) Density of Perturb-seq reads along the mitochondrial genome for select genetic perturbations. Reads are aligned to both the H-strand (dark gray) and L-strand (light gray).
(C) Comparison of mitochondrial gene expression profiles between Perturb-seq and bulk RNA-seq. Heatmap displays changes in expression of the 13 mitochondria-encoded genes (columns) for perturbations (rows) in Perturb-seq and bulk total RNA-seq data collected from K562 cells.
(D) Clustering of TMEM242 genetic perturbation based on the mitochondrial transcriptome. Genetic perturbations to members of ATP synthase and complex I of the respiratory chain were compared with knockdown of TMEM242, a mitochondrial gene of unknown function. Gene expression profiles were restricted to the 13 mitochondrially encoded genes. The heatmap displays the Pearson correlation between pseudobulk z-normalized gene expression profiles of mitochondrial perturbations in K562 cells.
(E) Effect of TMEM242 knockdown on mitochondrial respiration. A Seahorse analyzer was used to monitor oxygen consumption rate (OCR) through a Mito stress test. Data are presented as average ± SEM, n = 6.
(F) Schematic diagram of mitochondrial stress response.
See also Figure S8.
