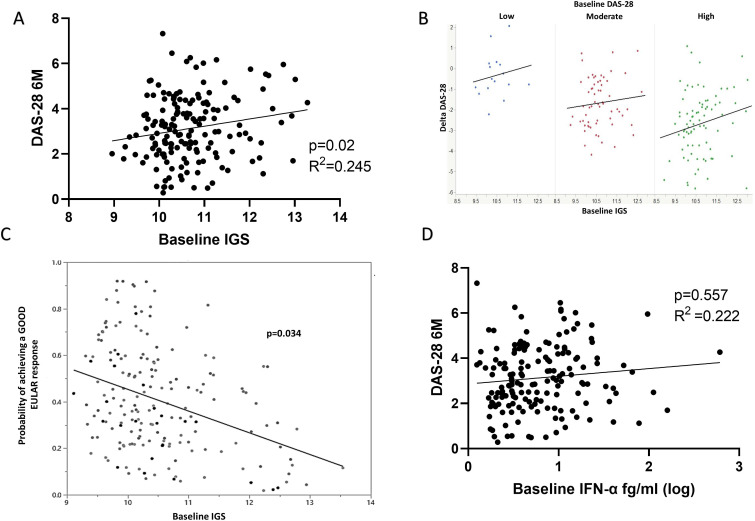
Figure 1.
The IGS, circulating IFN-α and clinical outcomes. Early drug naïve RA patients (eRA, n=165) had their IGS calculated from whole blood microarray expression of IFI6, OAS1, MxA, ISG15, IFI44L and the impact of this baseline IGS on 6 month clinical outcomes sought. (A) Linear regression between baseline IGS and DAS-28 at 6 months (6M), p=0.02, R2=0.245. (B) Graphical depiction of baseline IGS consistently impacting on change in DAS-28 at 6 months (Delta DAS-28) regardless of baseline DAS-28 (p=0.017, multivariable regression). Blue dots represent patients with baseline low DAS-28(<3.1), red moderate DAS-28 (3.2–5.1) and green high DAS-28 (>5.1). A negative Delta DAS-28 (Y axis) denotes a fall in DAS-28 and therefore response to therapy. (C) Relationship between the probability of achieving a good EULAR response at 6 months and baseline IGS. Nominal logistic regression, age, sex, DMARD, baseline DAS-28 and glucocorticoid administration corrected, p=0.034. (D) Linear regression between baseline IFN-α and DAS-28 at 6 months (6M), p=0.557, R2=0.222. DAS-28, disease activity score; DMARDS, disease-modifying antirheumatic drugs; IFN, interferon; IGS, gene signature; RA, rheumatoid arthritis.

