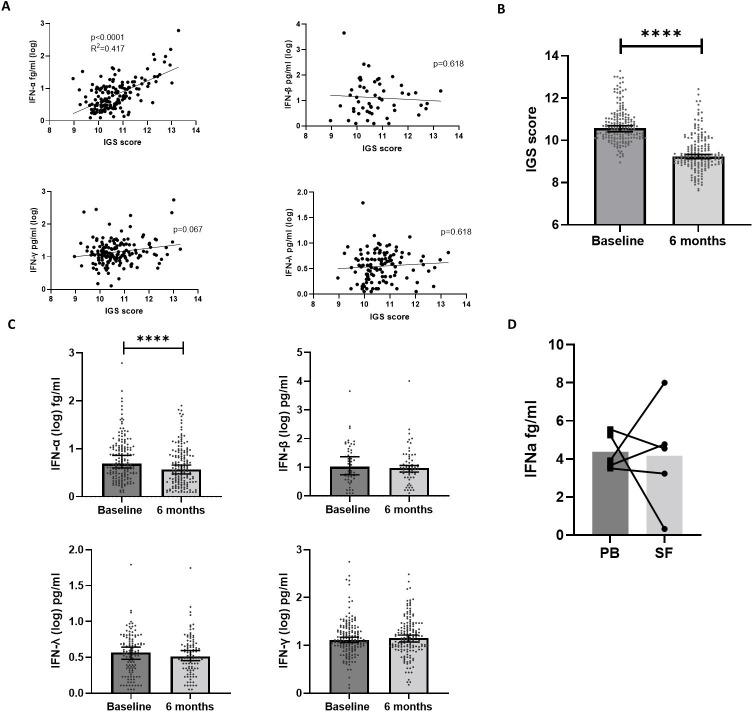
Figure 2.
Circulating IFN-I, -II, –III, the IGS and longitudinal expression. (A) Linear regression was performed between the IGS and circulating IFN-α (n=163, p<0.0001, R2=0.29), IFN-β (n=53, p=0.817, R2=0.001), IFN-γ (n=164, p=0.067, R2=0.034), IFN-λ (n=117, p=0.345, R2=0.007). (B) Paired IGS scores between baseline and 6 months in eRA (n=165). Median values are depicted with 95% CIs and statistical analysis using Wilcoxon signed rank test performed on the differences between baseline and 6 months. (C) Comparisons between baseline and 6 month circulating levels of IFN-α, IFN-β, IFN-γ and IFN-λ. Median values are depicted with 95% CIs and statistical analysis using Wilcoxon signed rank test performed on the differences between baseline and 6 months. (D) Comparison of circulating peripheral blood (PB) IFN-α and synovial fluid (SF) IFN-α from five patients with RA, four of whom had established RA and one who had early RA, Wilcoxon signed rank test demonstrated no significant difference. Median values are depicted with paired samples demonstrated. ****p<0.0001. IFN, interferon; IGS, gene signature; RA, rheumatoid arthritis.

