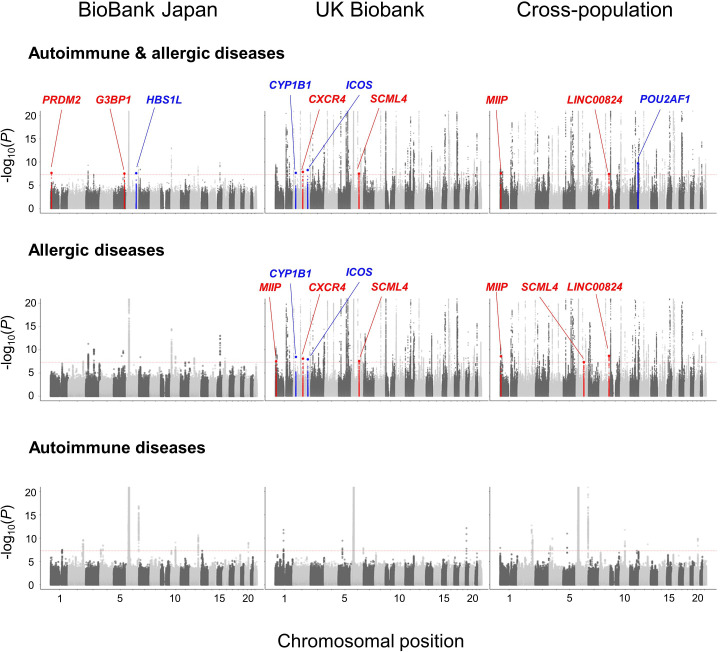
Figure 2.
Manhattan plots of the GWAS meta-analysis for the autoimmune and allergic diseases. Manhattan plots of the GWAS meta-analysis of six autoimmune and allergic diseases (upper), three allergic diseases (middle) and three autoimmune diseases (lower). The y-axis indicates −log10(P) of association of each variant calculated in three cohorts: BBJ (left), UKB (middle), cross-population (right). The upper limit is set to 20 for the sake of clarity. In the loci which we identified, the novel ones are coloured in red and independent ones are coloured in blue. The horizontal dashed red line indicates the genome-wide significance threshold (p=5.0 × 10⁻⁸). BBJ, BioBank Japan; GWAS, genome-wide association study; UKB, UK Biobank.

