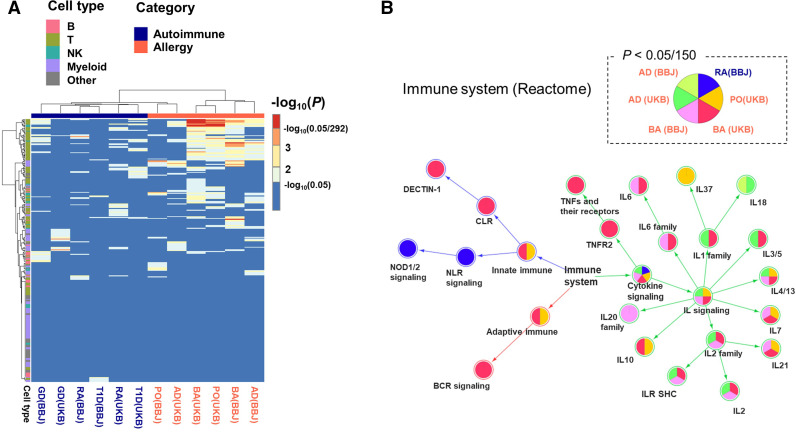
Figure 4.
Enrichment analysis for six autoimmune and allergic diseases. (A) A heatmap describing the 292 immune cell-type enrichment using LDSC referring ImmGen gene expression data. The row and column are hierarchically clustered. The row annotations are coloured based on five cell types (B cell, T cell, NK cell, myeloid cell, and others), and the column annotations are coloured according to whether it is an autoimmune or an allergic disease. (B) The pathway network of immune system in Reactome database. The nodes are coloured according to whether the individual GWAS data are significantly enriched at a significance level of 0.05/150. For the sake of clarity, only nodes that have at least one enriched disease are shown. AD, atopic dermatitis; BA, bronchial asthma; BBJ, BioBank Japan; GD, Grave’s diseases; GWAS, genome-wide association study; LDSC, linkage disequilibrium score regression; PO, pollinosis; RA, rheumatoid arthritis; T1D, type 1 diabetes; UKB, UK Biobank.

