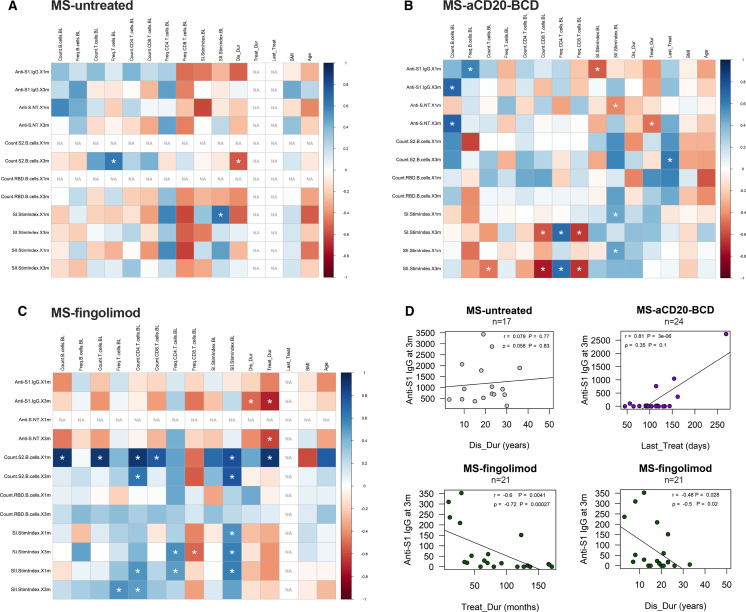
Figure 5.
SARS-CoV-2 mRNA vaccination outcome to immune constitution correlation. (A–C) Multiple correlation analyses for untreated patients with MS (A), MS-aCD20-BCD patients (B), and MS-fingolimod (C). The y-axis represents vaccination outcome variables, the x-axis potential correlation variables. The colour of the result depicts the magnitude and direction of the respective correlation as indicated in the key on the right side. Spearman correlations with a p value below 0.05 were considered significant and indicated by white asterisks. Correlations with less than five measured value pairs were excluded due to low robustness and indicated by ‘NA’. (D) Simple linear correlation for anti-S1-IgG at 3 months and disease duration (Dis_Dur; MS-untreated), days since last treatment administration (Last_Treat; MS-aCD20-BCD), disease duration and overall treatment duration (Treat_Dur; MS-fingolimod; from upper left clock-wise). MS, multiple sclerosis.

