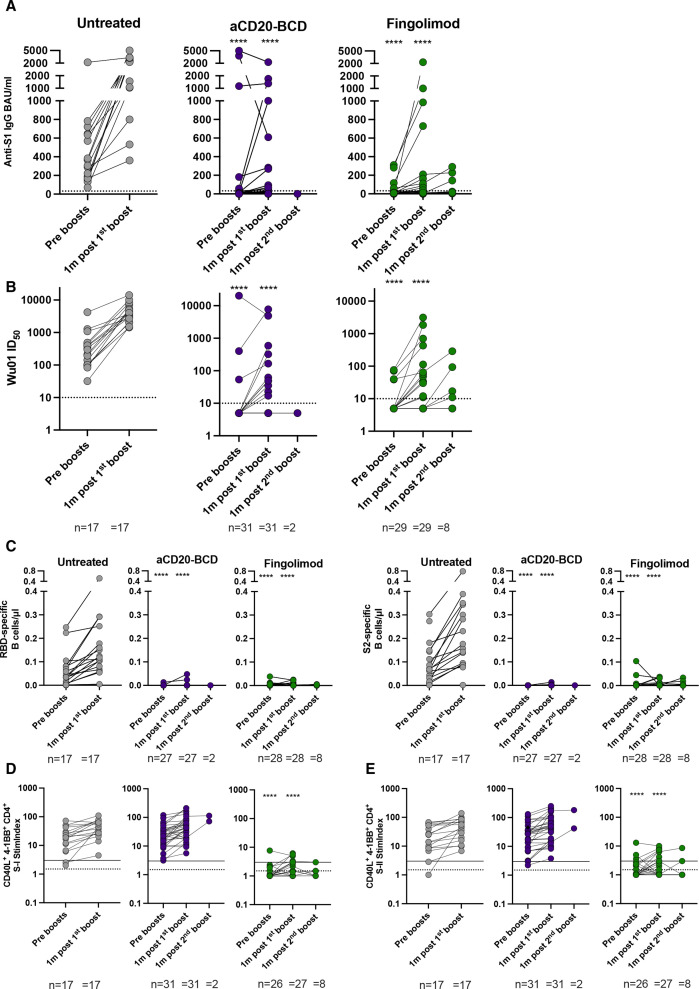
Figure 6.
Humoral and cellular responses to booster vaccinations in risk treatment groups. (A, B) Anti-S1 IgG response (A) and Wu01 spike neutralising capacity (B). (C) Absolute numbers of RBD-specific and S2-specific CD19+ B cells. (D) S-I-specific and S-II-specific CD4+ T cell reactivity. Lines indicate stimulation indices (StimIndex) of 1.5 (positive with uncertainty; dotted line) and 3.0 (definitely positive; solid line). For T cell gating see online supplemental figure 5. All data are shown for pre booster and 1 month after each booster (1 month post first boost; 1 month post second boost) for untreated, aCD20-BCD-treated and fingolimod-treated patients. Each dot represents the determined value for a patient. The number of patients per time point for each respective group is provided below each plot. Kruskal-Wallis test followed by Dunn’s multiple comparisons test were performed to test treatment groups in comparison to untreated patients at the respective time points. Significance levels indicate differences between the respective treatment group and the untreated cohort and are reported as: ****p≤0.0001. Non-significant results were not reported.

