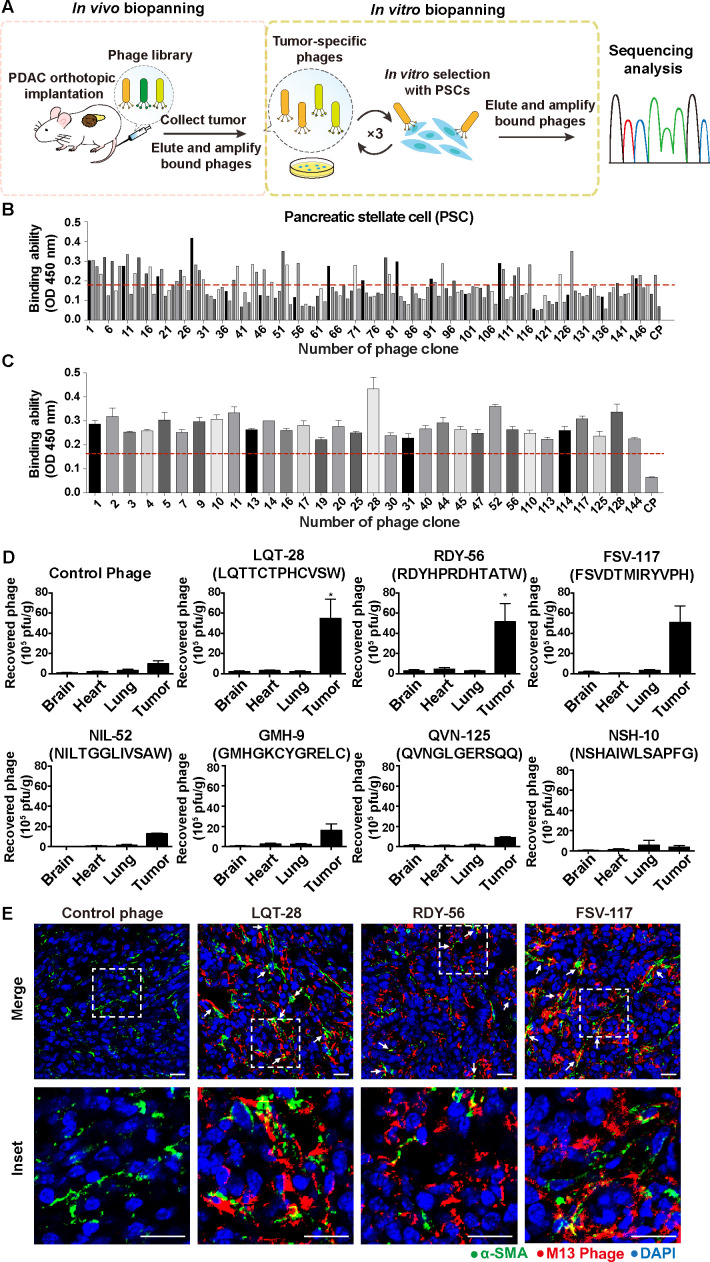
Figure 3.
In vitro/in vivo combinatorial biopanning of the Ph.D.−12 phage display peptide library in a murine orthotopic PDAC model in vivo and in human PSCs in vitro. (A) Schematic diagram of the method used for in vitro–in vivo combinatorial phage display biopanning. A phage display random peptide library was intravenously injected into orthotopic murine PDAC models generated using AK4.4.28 One hour after injection, bound phages were isolated from PDAC tumours and amplified for subsequent rounds of biopanning. After the first round of in vivo selection, we performed three cycles of in vitro biopanning using human PSCs. Enriched phages from the third in vitro biopanning round were randomly selected for amplification, and the affinity of each selected phage for PSCs was evaluated by ELISA and compared with that of a negative control helper phage. The gene encoding the PDAC tumour stroma-specific oligopeptide displayed on the selected phage was amplified by PCR, cloned and sequenced. (B) Identification of phages capable of binding primary, culture-activated human PSCs. PDAC stroma-bound phage clones were selected by ELISA. A control phage without an insert was used as the negative control (control phage). The red line indicates a threshold binding affinity >2.5-fold greater than that of the negative control helper phage threshold. (C) primary culture-activated human PSCs were incubated with representative positively selected phage clones expressing different sequences. The binding affinities were measured using phage ELISA (n=3). The red line indicates a threshold binding affinity >2.5-fold greater than that of the negative control helper phage threshold. (D) Verification of the tumour-homing abilities of phage clones in the orthotopic PDAC model. PDAC (AK4.4) orthotopic tumour-bearing mice were intravenously injected with phage clones. One hour later, the organs/tumours were harvested, and the phages were recovered and titrated using the plaque assay (n=3–6). Two-tailed Mann-Whitney U test, *p<0.05 compared with the negative control helper phage. (E) Representative images of immunofluorescence) staining to detect phage clones in PDAC. Red, phage (anti-M13 antibody); green, α-SMA; blue, nuclei (DAPI). Scale bars, 20 µm. All data are shown as the mean±SE of the mean (SEM). PDAC, pancreatic ductal adenocarcinoma; PSC, pancreatic stellate cells; SMA, smooth muscle actin.

