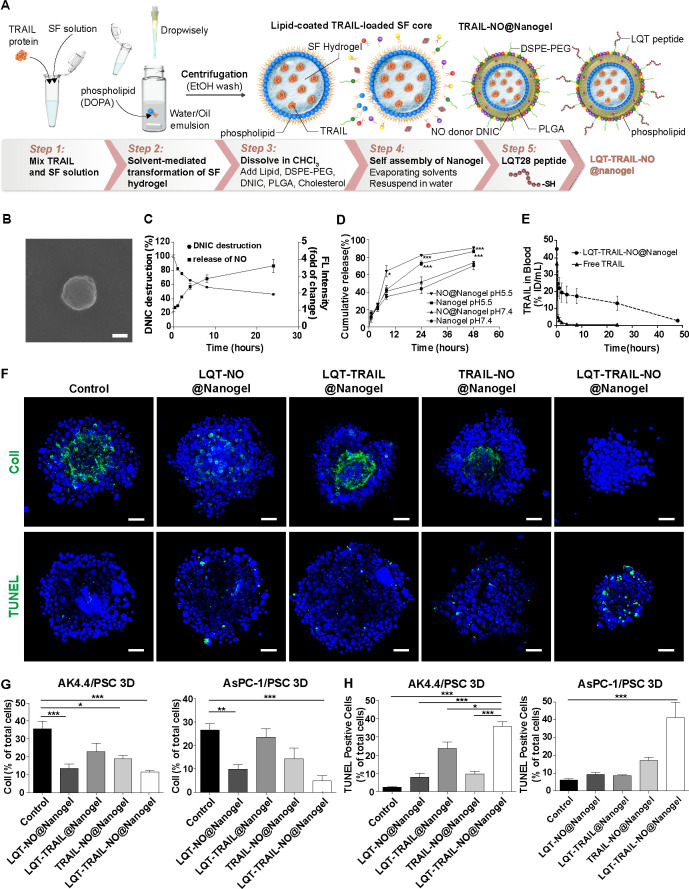
Figure 6.
Delivery of TRAIL and NO by tumour stroma-targeted nanogels reduced collagen I production and enhanced apoptosis induction in PDAC/PSC 3D culture models. (A) Schematic illustration of the preparation of LQT-TRAIL-NO@Nanogel. The TRAIL-loaded SF hydrogel core was first synthesised by the solvent-mediated transformation of SF hydrogel. Using microemulsion technology, the SF hydrogel core was then coated with phospholipid DOPA to form a well-dispersed suspension in organic solvent. Next, the hydrophobic lipid-coated SF hydrogel core was formulated into lipid-PLGA NPs to form the TRAIL@Nanogel. To co-deliver NO and TRAIL into PDAC, DNIC was loaded into the TRAIL@Nanogel to form the TRAIL-NO@Nanogel. Finally, to achieve tumour stroma-targeted delivery of the TRAIL-NO@Nanogel into PDAC, the LQT28 peptide was conjugated on the surface of NPs to form the LQT-TRAIL-NO@Nanogel. (B) A representative scanning electron micrograph of the LQT-TRAIL-NO@Nanogel. Scale bar, 100 nm. (C) Kinetics of DNIC degradation and NO release from the NO@Nanogel under physiological conditions (pH 7.4). The NO@Nanogel was incubated in PBS, and DNIC degradation was measured at 360 nm using a UV spectrophotometer (n=9). The results are expressed as the percentage of the initial DNIC content. The release of NO was measured as the fluorescence intensity (excitation at 566 nm and emission at 596 nm) of the NO-specific probe DAR-1. The results are expressed as fold changes compared with time 0 (n=3). (D) Kinetics of cargo protein (FITC-BSA) release from the nanogel or NO@Nanogel under different pH conditions. Nanogel or NO@Nanogel loaded with FITC-BSA was incubated in PBS (pH 7.4) or acetic acid buffer (pH 5.5), and FITC-BSA release was measured using a plate reader at an excitation wavelength of 494 nm and an emission wavelength of 520 nm (n=3–6). *P<0.05 and ***p<0.001 compared with the nanogel at pH 7.4. (E) Serum concentration profiles of free-form FITC-labelled TRAIL in different formulations (n=3). (F) Representative immunofluorescence images of AsPC-1 PDAC cell/PSC 3D spheroid cultures after treatment with different formulations. Green, collagen I or TUNEL staining; blue, nuclei (DAPI). Scale bars, 50 µm. (G) Expression levels of collagen I in PSC 3D spheroid cultures consisting of PDAC tumour cells (murine AK4.4 or human AsPC-1 PDAC cells) and PSCs after 48 hours of treatment with TRAIL and/or DNIC loaded in different formulations were analysed and quantified by immunostaining (n=5–15). (H) Apoptosis induction in PSC 3D spheroid cultures consisting of PDAC tumour cells (murine AK4.4 or human AsPC-1 PDAC cells) and PSCs after 48 hours of treatment with TRAIL and/or DNIC loaded in different formulations was analysed and quantified by immunostaining TUNEL staining (n=5–17). All data are shown as the mean±SEM. *P<0.05, **p<0.01, ***p<0.001. 3D, three-dimensional; DNIC, dinitrosyl iron complexesn; FITC-BSA, fluorescein isothiocyanate-labelled bovine serum albumin; NO, nitric oxide; NPs, nanoparticles; PBS, phosphate-buffered saline; PDAC, pancreatic ductal adenocarcinoma; PLGA, poly(lactic-coglycolic) acid; PSC, pancreatic stellate cells; SF, silk fibroin; TRAIL, tumour necrosis factor-related apoptosis-inducing ligand.

