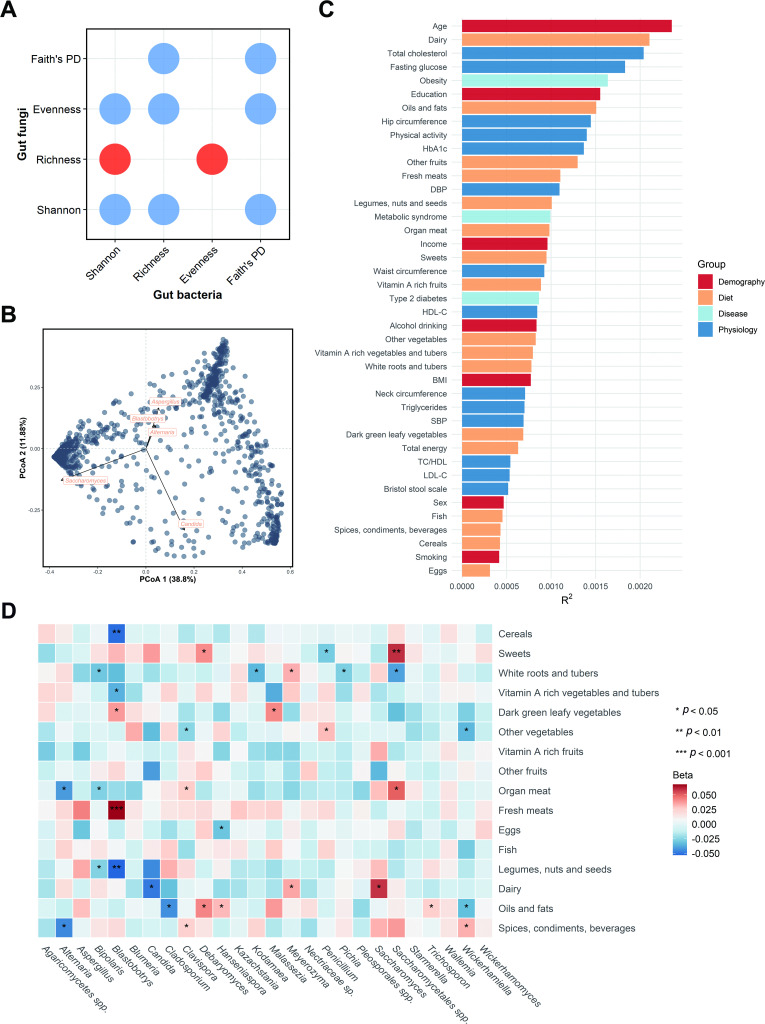
Figure 2.
Determinants of gut fungal structural variation. (A) Dot plot shows the associations between gut fungal and bacterial α-diversity indices. The red indicates a positive association, while blue indicates a negative association. (B) Top five contributors to fungal community variation was determined by envfit analysis (p<0.001), plotted on the two first PCoA dimensions. (C) The effect sizes of host factors on human gut mycobiome were evaluated by permutational multivariate analysis of variance (Adonis, permutations=999, n=1188, baseline). The bars were coloured according to metadata categories. (D) Associations between long-term dietary habits and gut mycobiome (n=1239). Beta and p values were calculated in a linear regression model adjusted for age, gender, BMI, total energy, smoking status, drinking status, income level, education, physical activity and Bristol stool scale. The quartiles of dietary variables were z-score transformed. ‘sp‘ or ‘spp‘ here represents unidentified fungal genus. BMI, body mass index; DBP, diastolic blood pressure; HbA1c, glycated haemoglobin; HDL-C, high-density lipoprotein cholesterol; LDL-C, low-density lipoprotein cholesterol; PCoA, principal coordinate analysis; PD, phylogenetic diversity; SBP, systolic blood pressure; TC:HDL, total cholesterol:high-density lipoprotein cholesterol ratio.

