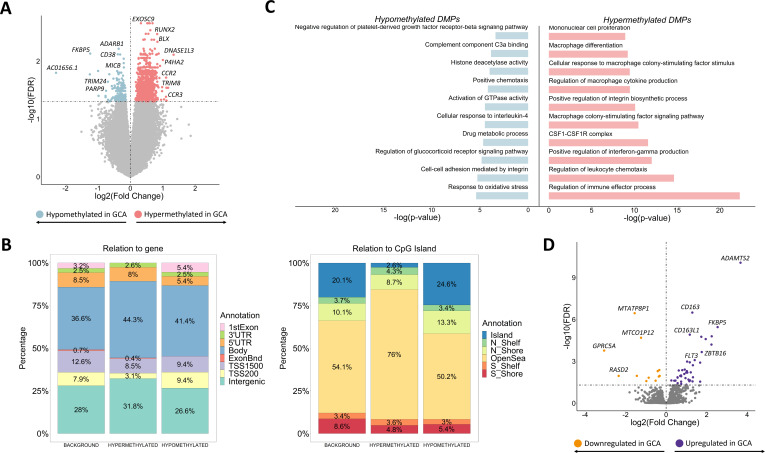
Figure 1.
Results from the comparison of both DNA methylation and gene expression patterns of CD14+ monocytes between patients with giant cell arteritis and controls. (A) Volcano plot of the epigenome-wide association study results. False discovery rate (FDR) values are represented on the –log10 scale in the y-axis. Significant threshold (FDR<0.05) is marked by a dashed line. The effect size and direction obtained for each CpG site is depicted in the x-axis. Pink and blue dots represent hypermethylated and hypomethylated differentially methylated positions (DMPs), respectively. (B) Bar plots representing the annotation of the significant hypermethylated and hypomethylated DMPs in relation to CpG island (right panel) and gene location (left panel). (C) Representation of selected gene ontology categories obtained from the DMPs enrichment analysis using the GREAT online tool. (D) Volcano plot of the transcriptome-wide association study results. FDR values are represented on the –log10 scale in the y-axis. Significant threshold (FDR<0.05) is marked by a dashed line. The effect size and direction obtained for each gene is depicted in the x-axis. Purple and orange dots represent upregulated and downregulated differentially expressed genes, respectively. GCA, giant cell arteritis.

