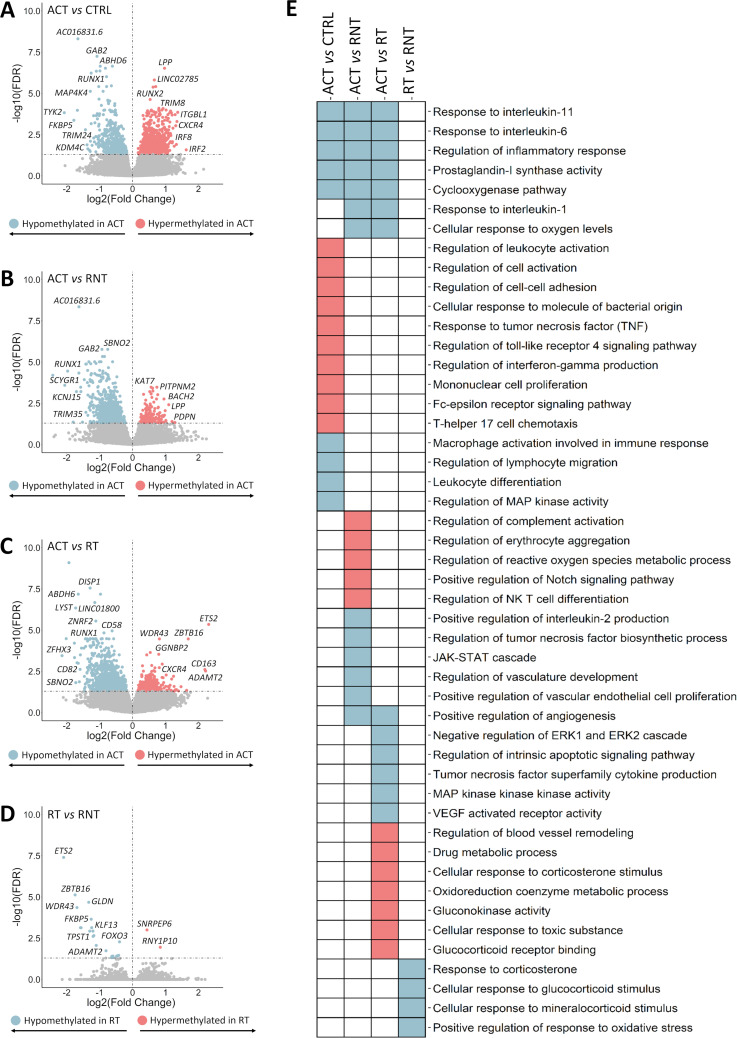
Figure 3.
Results of the epigenome-wide association study obtained from the stratified analysis of patients according to the state of the disease. (A–D) Volcano plots showing the results of the epigenome-wide association study for each comparison performed. False discovery rate (FDR) values are represented on the –log10 scale in the y-axis. Significant threshold (FDR<0.05) is marked by a dashed line. The effect size and direction obtained for each CpG site is depicted in the x-axis. Pink and blue dots represent hypermethylated and hypomethylated differentially methylated positions (DMPs), respectively. (E) Scheme summarising the results from the gene ontology enrichment analysis performed using the GREAT online tool. Columns show the different comparisons carried out in the stratified analysis and rows represent selected gene ontology categories. Pink colour denotes statistical significant enrichment of hypermethylated DMPs and blue colour indicates statistical significant enrichment of hypomethylated DMPs. ACT, active disease; CRTL, controls; RT, remission with treatment; RNT, remission without treatment.

