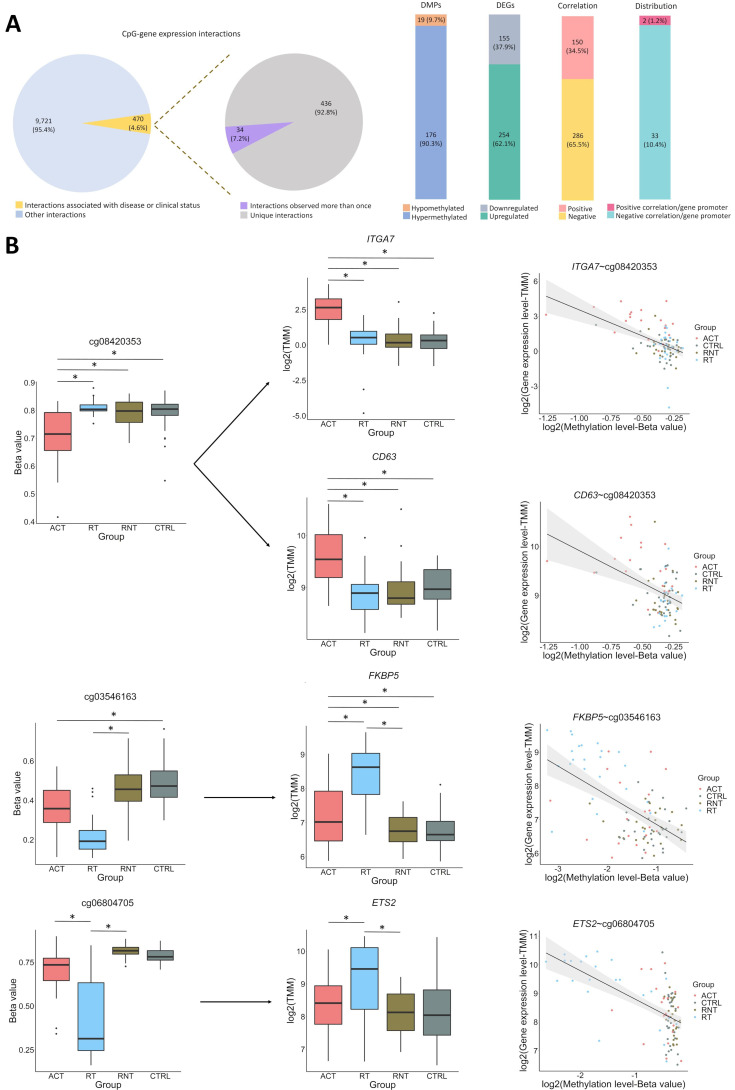
Figure 5.
Integrative analysis of DNA methylation and gene expression. (A) General description of the significant CpG-gene expression interactions identified in our analysis. (B) Selected examples of specific CpG-gene expression interactions. Box plots representing both the differentially methylated positions (DMPs) and the differentially expressed genes (DEGs). Significant differences are marked (*FDR<0.05). Graphical representation of the correlation of DNA methylation and gene expression of DMP-DEG pairs is also shown. DNA methylation and gene expression levels are illustrated in each subset of individuals. ACT, active disease; CRTL, controls; RT, remission with treatment; RNT, remission without treatment.

