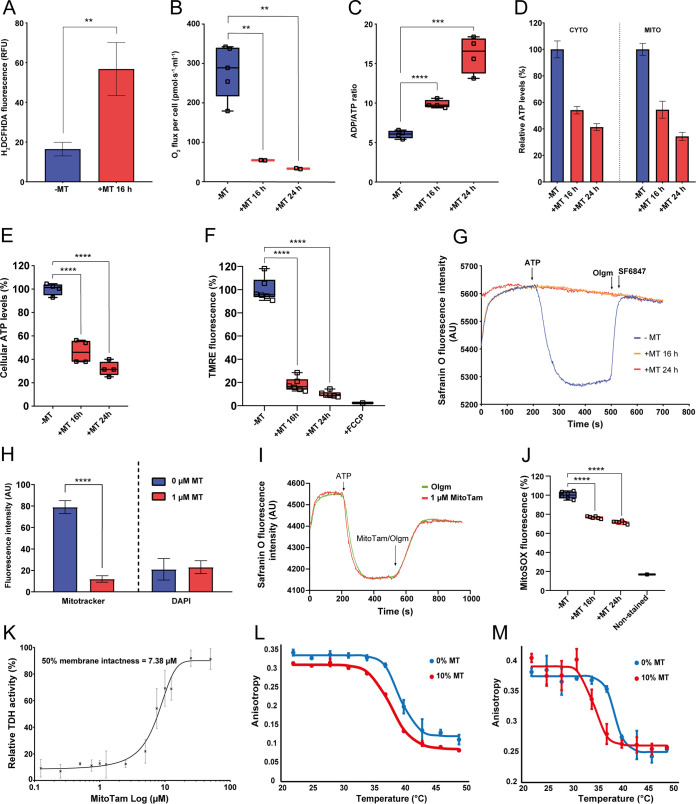
FIG 4.
Overall effect of MitoTam on the T. brucei cell. (A) Production of intracellular ROS in BSF T. brucei was quantified by flow cytometry using DCFH-DA detection reagent in untreated control cells (−MT, blue) and cells treated with 100 nM MitoTam for 16 h (+MT 16 h, red) (mean ± s.d., n = 3, **, P < 0.01). (B) The O2 flux per cell using high-resolution respirometry after addition of glycerol-3-phosphate was determined in BSF T. brucei untreated control cells (−MT, blue) and BSF cells treated with 100 nM MitoTam for 16 h (+MT 16 h, red) and 24 h (+MT 24 h, red) (box and whisker plot, n = 3, **, P < 0.01). (C) Relative ADP/ATP ratio analyzed using a bioluminescence assay kit in BSF T. brucei untreated control cells (−MT, blue) and BSF cells treated with 100 nM MitoTam for 16 h (+MT 16 h, red) and 24 h (+MT 24 h, red) (box and whisker plot, n = 3, ***, P < 0.001, ****, P < 0.0001). (D) Cytosolic and mitochondrial ATP levels were assessed in transgenic BSF T. brucei cell lines expressing firefly luciferase. Untreated control cells (−MT, blue) were compared with cells treated with 100 nM MitoTam for 16 h (+MT 16 h, red) and 24 h (+MT 24 h, red). Data were normalized to the values of the untreated control cells and expressed as a percentage (mean ± s.d., n = 4). (E) Total cellular ATP levels in BSF T. brucei were determined using a bioluminescence assay kit. Data from cultures treated with MitoTam for 16 h (+MT 16 h, red) and 24 h (+MT 24 h, red) were normalized to the respective values of the untreated control cells (−MT, blue) and expressed in percentage (box and whisker plot, n = 4), ****, P < 0.0001). (F) Flow cytometry of TMRE stained cells was used to determine ΔΨm of BSF T. brucei. Data from cultures treated with 100 nM MitoTam for 16 h (16 h +MT, red) and 24 h (+MT 24 h, red) were normalized to the respective values of the untreated control cells (−MT, blue) and expressed in percentage. Uncoupler FCCP was added as a control for ΔΨm depolarization (box and whisker plot, n = 6, ****, P < 0.0001). (G) In situ ΔΨm was measured in digitonin-permeabilized BSF T. brucei cells stained with Safranin O dye. Where indicated, the FoF1-ATP synthase substrate—ATP, the FoF1-ATP synthase inhibitor—oligomycin (Olgm) and the protonophore SF6847 were added. Representative trace from the measurement of untreated control cells (−MT, blue) in comparison with cells treated with 100 nM MitoTam for 16 h (+MT 16 h, orange) and 24 h (+MT 24 h, red) is shown. (H) Automated microscopic analysis of BSF T. brucei cells stained with Mitotracker Red CMX-ROS was used to determine ΔΨm in control untreated cells (0 μM MT) and in cells treated with 1 μM MitoTam for 1 h (1 μM MT). Staining with DAPI was used as an internal control for the analysis. Mean signal intensities of Mitotracker Red CMX-ROS and DAPI are depicted on the y axis (mean ± s.d., ****, P < 0.0001). (I) In situ ΔΨm was measured in digitonin-permeabilized BSF T. brucei cells stained with Safranin O dye. Where indicated, the FoF1-ATP synthase substrate—ATP, the FoF1-ATP synthase inhibitor—oligomycin (Olgm, green line) and MitoTam (1 μM, red line) were added. (J) Red mitochondrial superoxide indicator MitoSOX was used to detect intramitochondrial ROS production in untreated BSF T. brucei control cells (−MT, blue) and BSF cells treated with 100 nM MitoTam for 16 h (+MT 16 h, red) and 24 h (+MT 24 h, red). Data were normalized to the values of the untreated control cells and expressed as a percentage (mean ± s.d., n = 6, ****, P < 0.0001). (K) Integrity of the inner BSF T. brucei mitochondrial membrane was assessed in isolated mitochondria incubated with increasing concentration of MitoTam. The mitochondrial enzyme threonine dehydrogenase (TDH) was used as a marker for permeability of the membrane, as the TDH activity is detectable only if a substrate passes freely through compromised mitochondrial membrane (mean ± s.d., n = 3). (L) Phase transition profile of artificial membranes prepared via hydration of lipide film (DPPC + MitoTam [MT] 0 and 10 mol % + 0.1 mol % DPH) with physiological saline and measured over range of temperatures (22 to 49°C). Fluidity change is plotted as a fluorescence anisotropy (r) against temperature. (M) Phase transition profile of artificial membranes prepared via hydration of lipide film (DPPC + MitoTam [MT] 0 and 10 mol % + 0.2 mol % TMA-DPH) with physiological saline and measured over range of temperatures (22 to 49°C). Fluidity change is plotted as a fluorescence anisotropy (r) against temperature.

