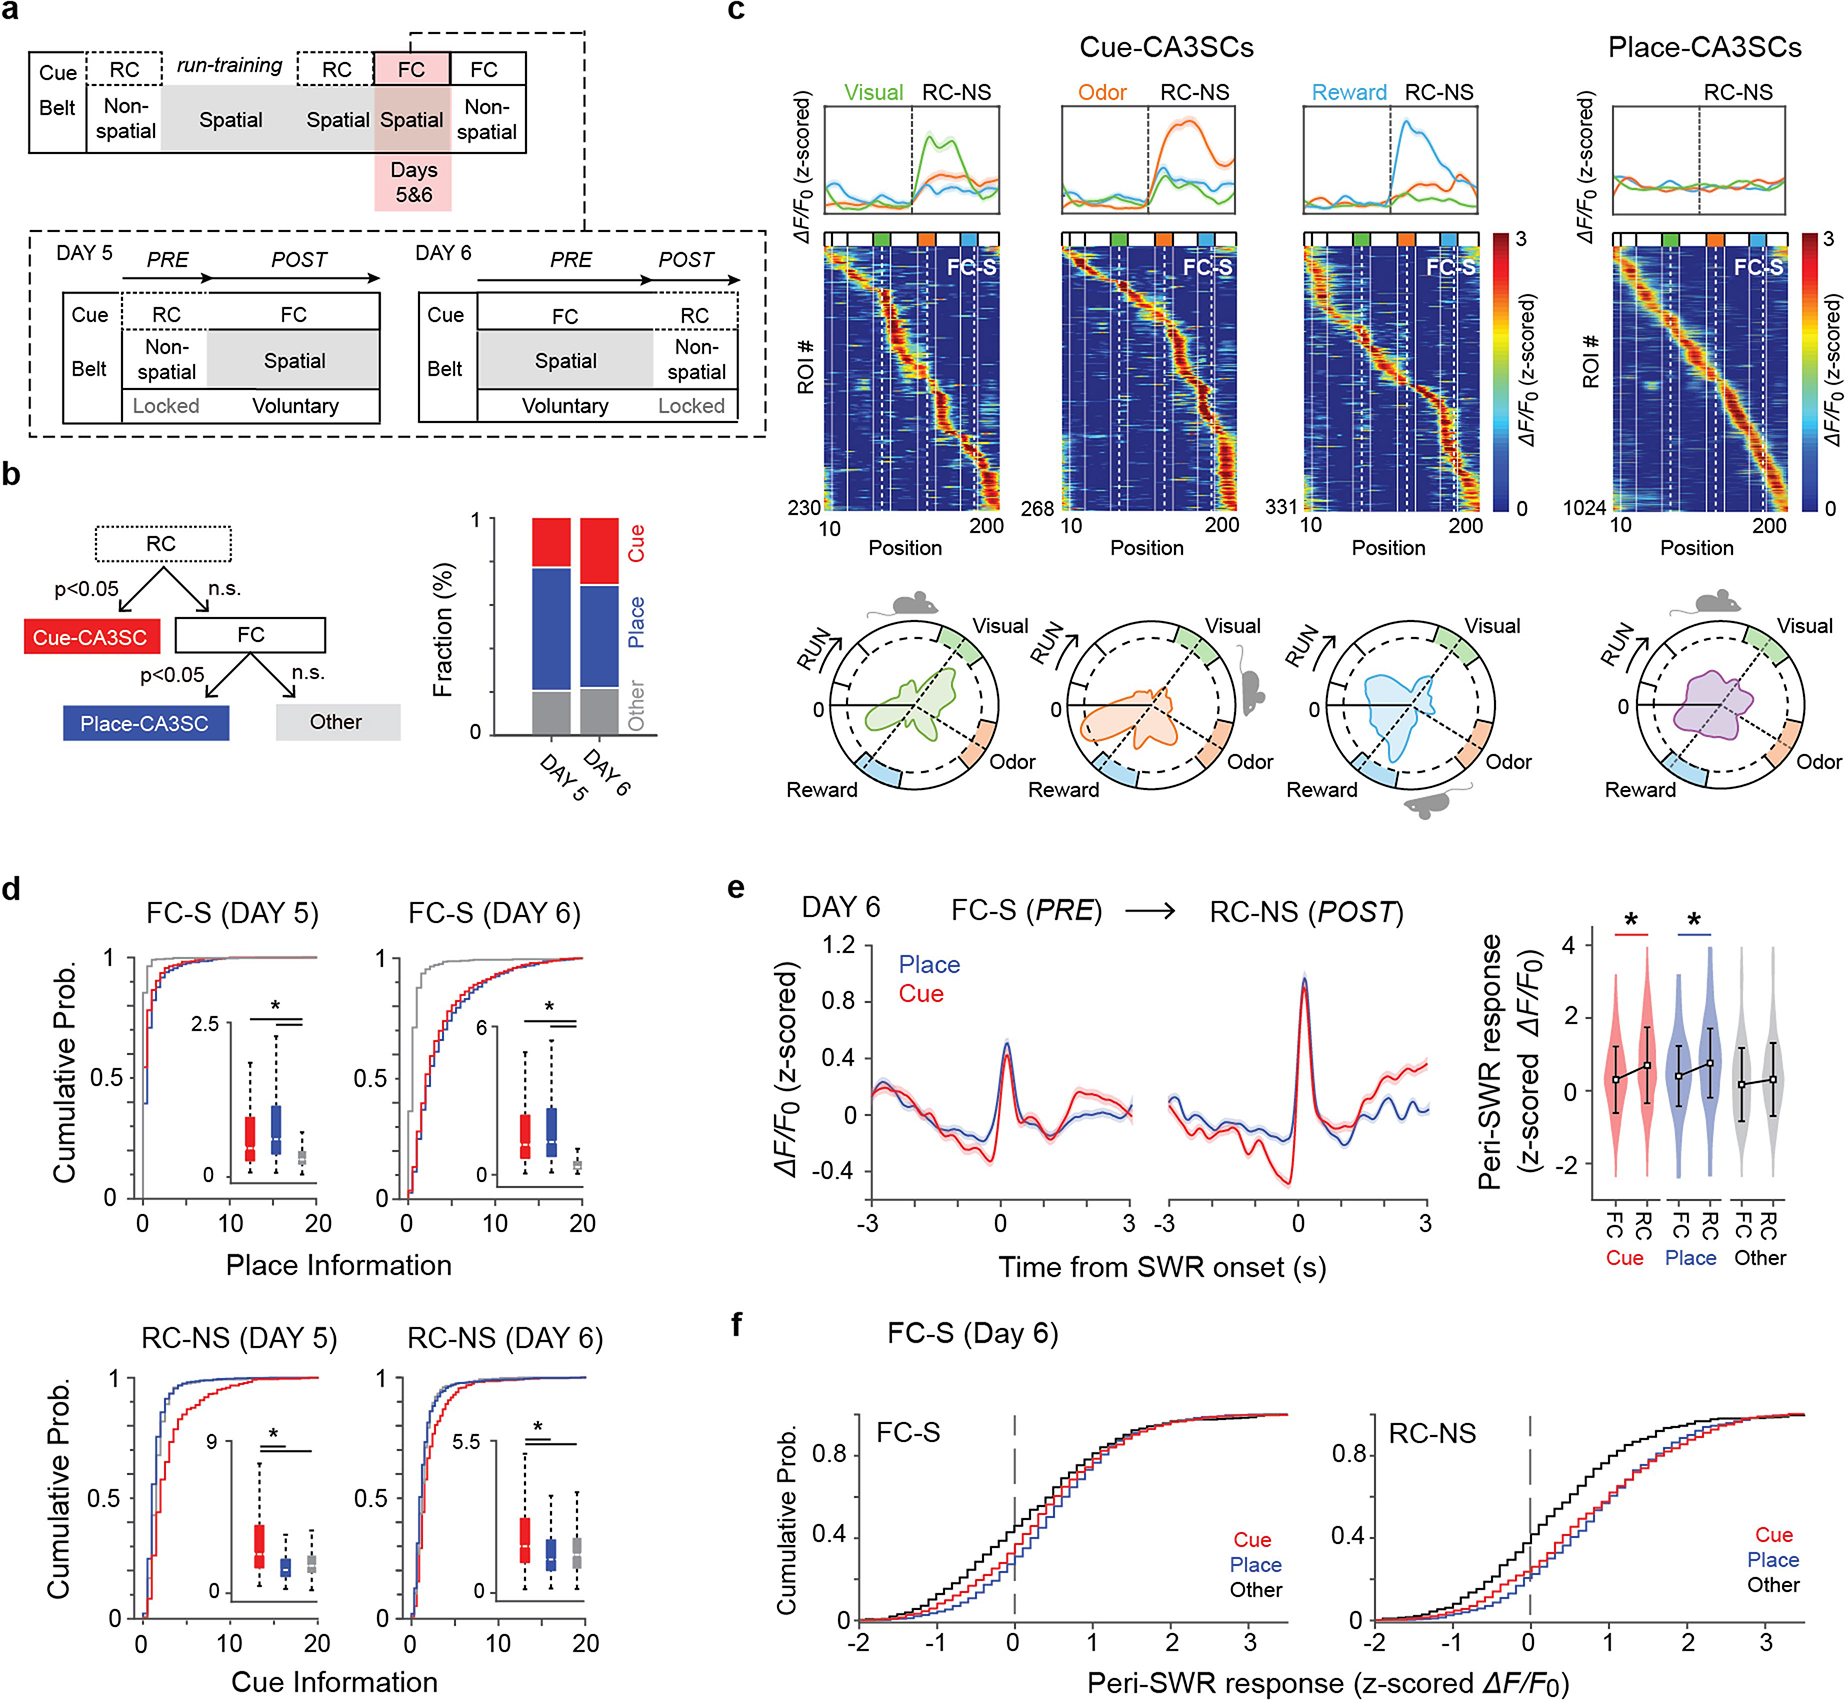
Extended Data Fig. 8 |. Spatial coding profiles of CA3SCs in FC-S.

a, Design of session block on Days 5 and 6 (Methods). b, Left, diagram of CA3SC ROI classification scheme on Days 5 and 6. Right, Fraction of active CA3SCs on Days 5 and Day 6. Each color indicates classified CA3SCs (Cue: n = 661, Place: n = 1,024, Other: n = 459 from 3 mice). c, Mean responses during RC-NS. Middle, Heatmap of place fields of individual cue-CA3SCs during FC-S with ROIs sorted according to location of peak activity to illustrate place coding (bottom). d, Cumulative histograms of cue-related and spatial information (bits). Mean±s.d. information values are shown in the insets. Cue- (red) and place- (blue) CA3SCs showed higher place information than other- (gray) CA3SCs on Day 5 (Cue: n=470, Place: n=1,170, Other: n = 418 from 3 mice). One-way ANOVA with post-hoc Tukey’s test. Main effect of ROI-type for both FC-S and RC-NS: P =4.6×10⁻⁹) and on Day 6 (Cue: n=661, Place: n=1,024, Other: n=459 from 3 mice. One-way ANOVA with post-hoc Tukey’s test. Main effect of ROI-type for both FC-S and RC-NS: P=1.5×10⁻⁵). e, peri-SWR activity in PRE and POST (left, mean±s.e.m.) summary of peri-SWR peak activity (right, mean±s.d.) for cue-, place- and other-CA3SCs on Day 6 (Two-way ANOVA with post-hoc Tukey’s test, main effect of RC-vs-FC: P=8.7×10⁻¹²; main effect of ROI-type: P=2.3×10⁻¹²; interaction: P=7.9×10⁻¹⁰). f, Cumulative distribution plots of peri-SWR, z-scored ΔF/F0 for all CA3SCs shown in (e).
