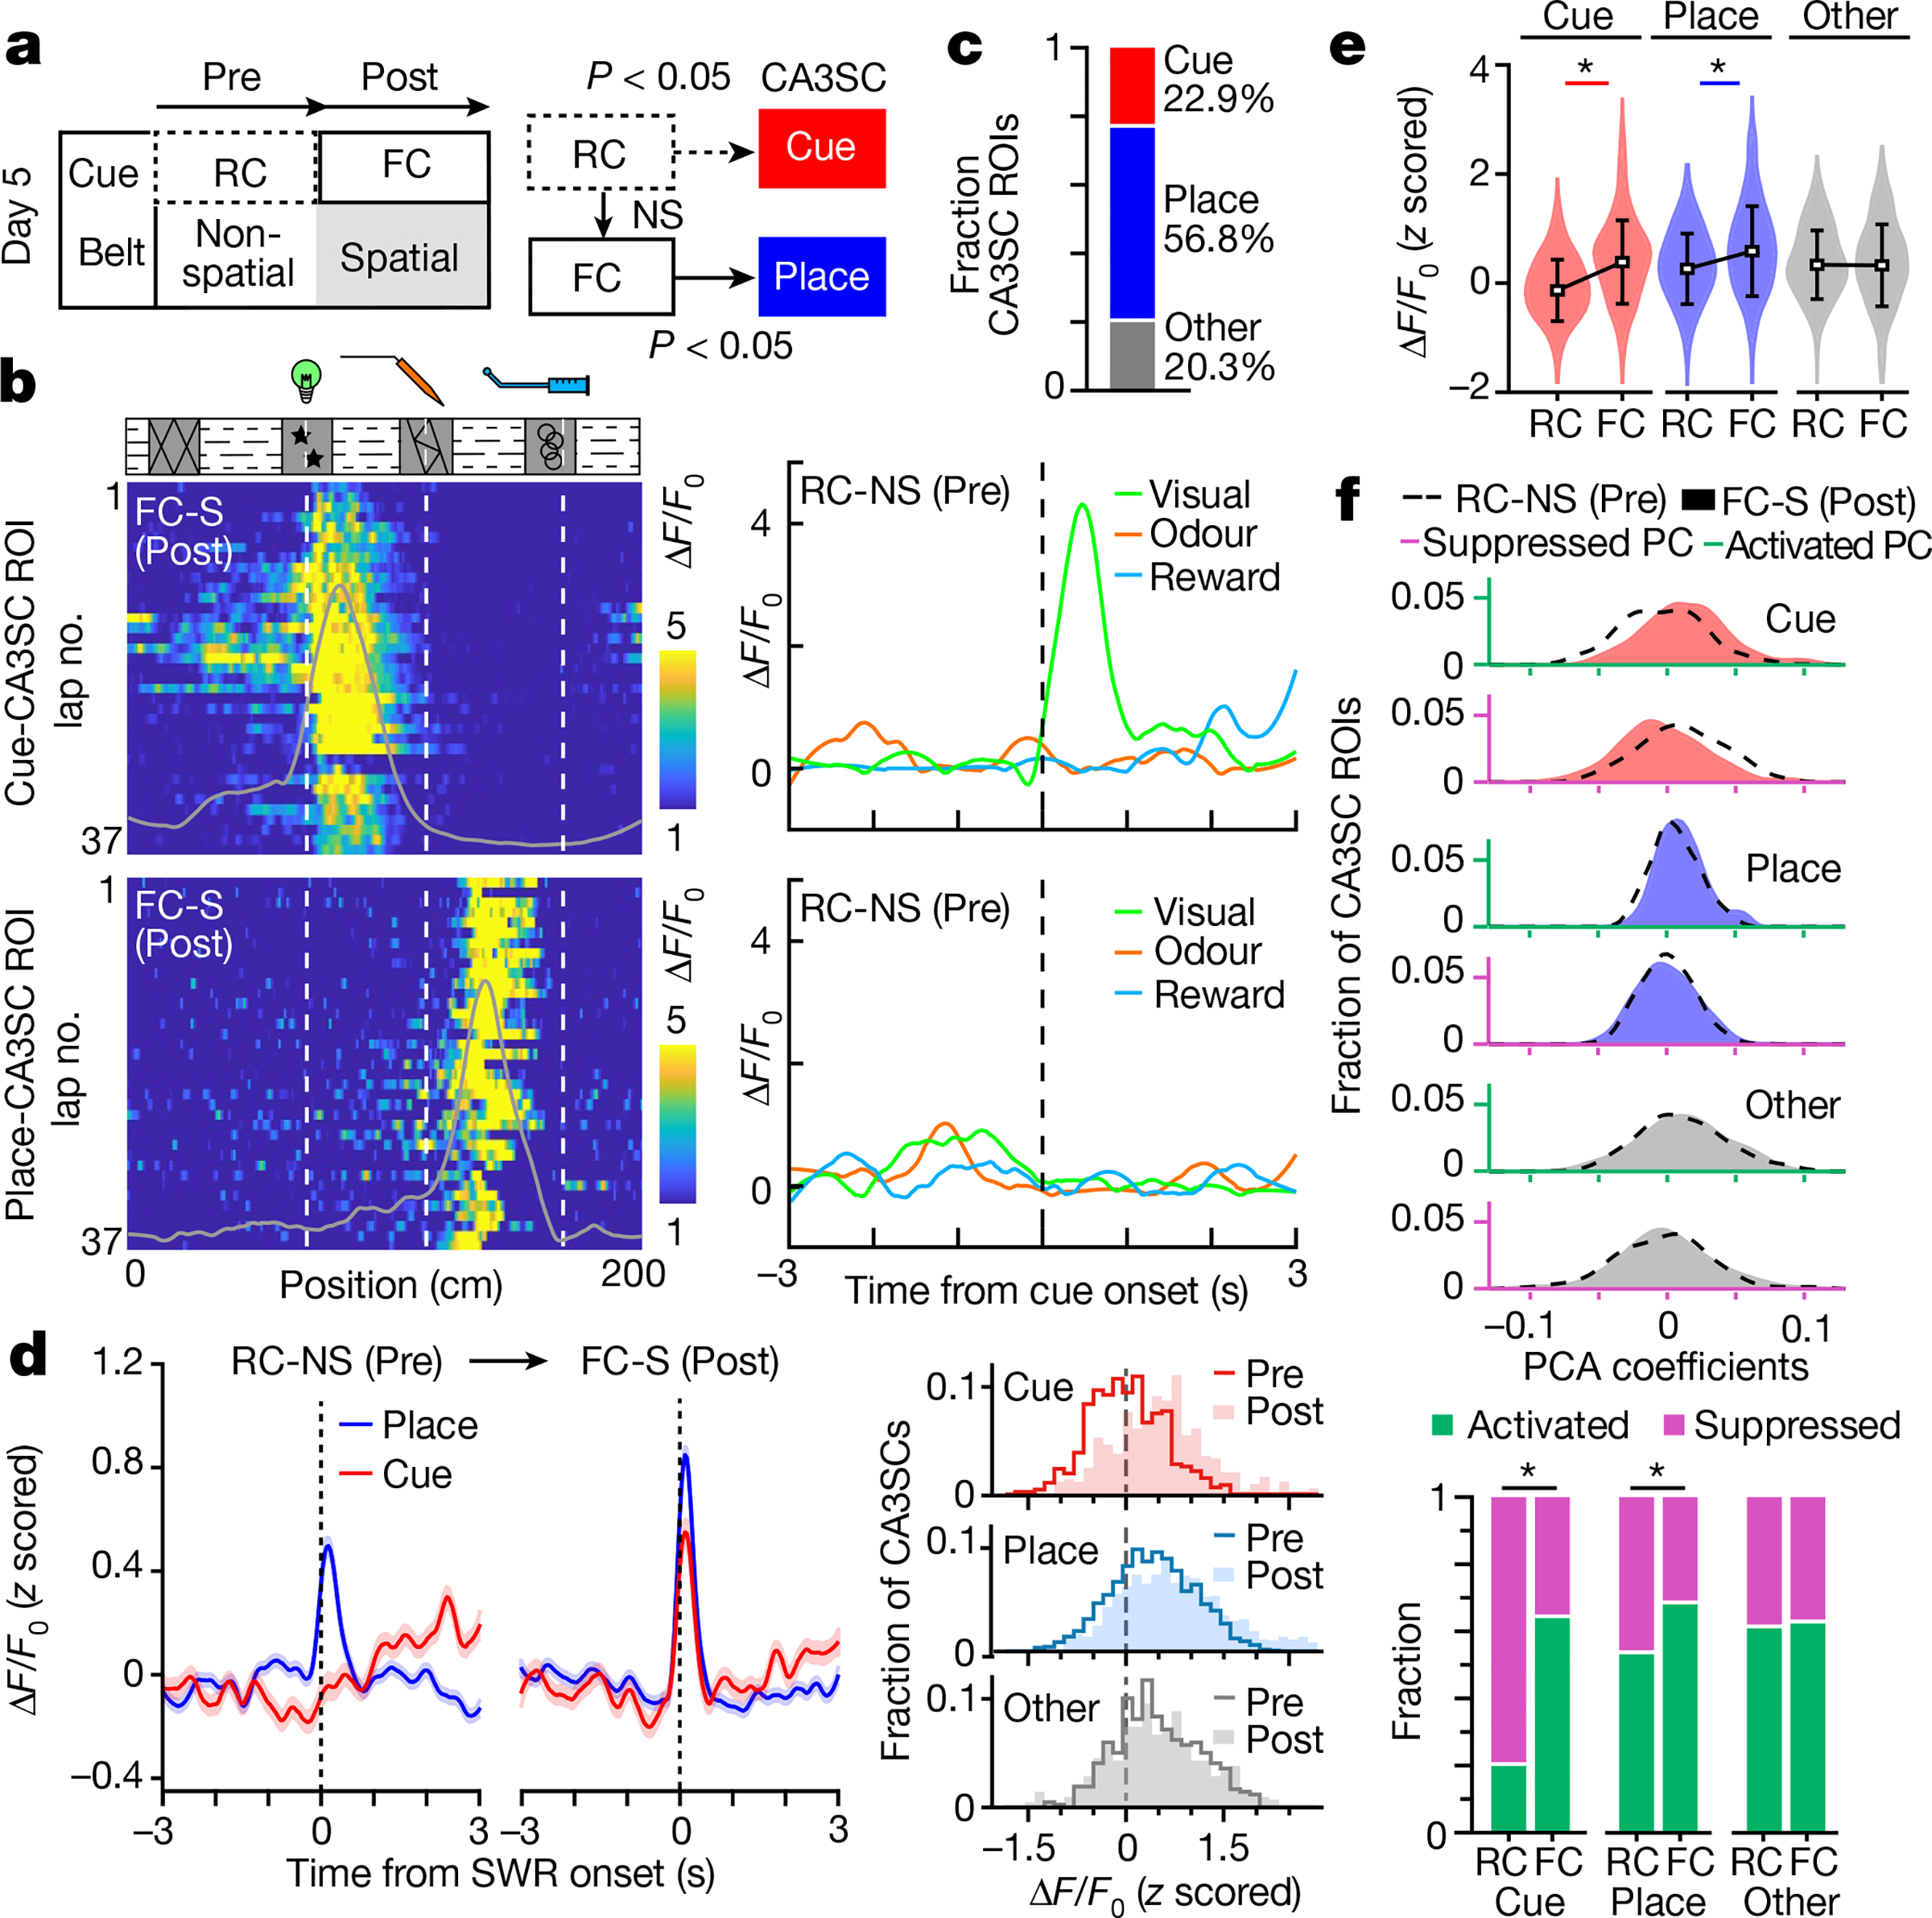
Fig. 3 |. Adaptive switch in reactivation of cue-CA3SCs during SWRs.

a, Left, design of the imaging session on day 5. Random sensory cues were presented on a non-spatial belt (RC-NS, Pre) before fixed cue and spatial (FC-S, Post) trials. Right, diagram of CA3SC ROI classification (Extended Data Fig. 8). NS, not significant. b, Left, lap-by-lap ΔF/F0 of a representative visual cue-CA3SC (top) and place-CA3SC (bottom) during the spatial task (Post). Right, average response of the same ROIs in the Pre trial. c, Fraction of cue-responsive (red), place-responsive (blue) and other (grey) CA3SCs. d, Left, comparison of peri-SWR response (mean ± s.e.m.) for cue- and place-CA3SCs from Pre and Post trials. Right, distributions of peak responses for cue-selective (top), place-selective (middle) and other (bottom) CA3SCs in the Pre (contour line) and Post (fill) trials. e, Summary (mean ± s.d.) of peri-SWR response magnitudes (Cue (red), n = 470; Place (blue), n = 1,170; Other (grey), n = 418; n = 3 mice; two-way ANOVA with Tukey’s post hoc test: RC × FC, P = 3.3 × 10⁻¹⁰; ROI type, P = 9.4 × 10⁻²⁶; interaction, P = 6.9 × 10⁻¹¹). *P < 0.05. f, Top, distributions of factor loadings for each principal component representing SWR-associated suppression and activation coefficients of all CA3SCs shown in c–e. Bottom, fraction of SWR recruitment of CA3SCs in the RC-NS and FC-S tasks (two-sided Fisher’s exact test: Cue, P = 1.1 × 10−43; Place, P = 1.9 × 10⁻¹³; Other, P = 0.72). *P < 0.05.
