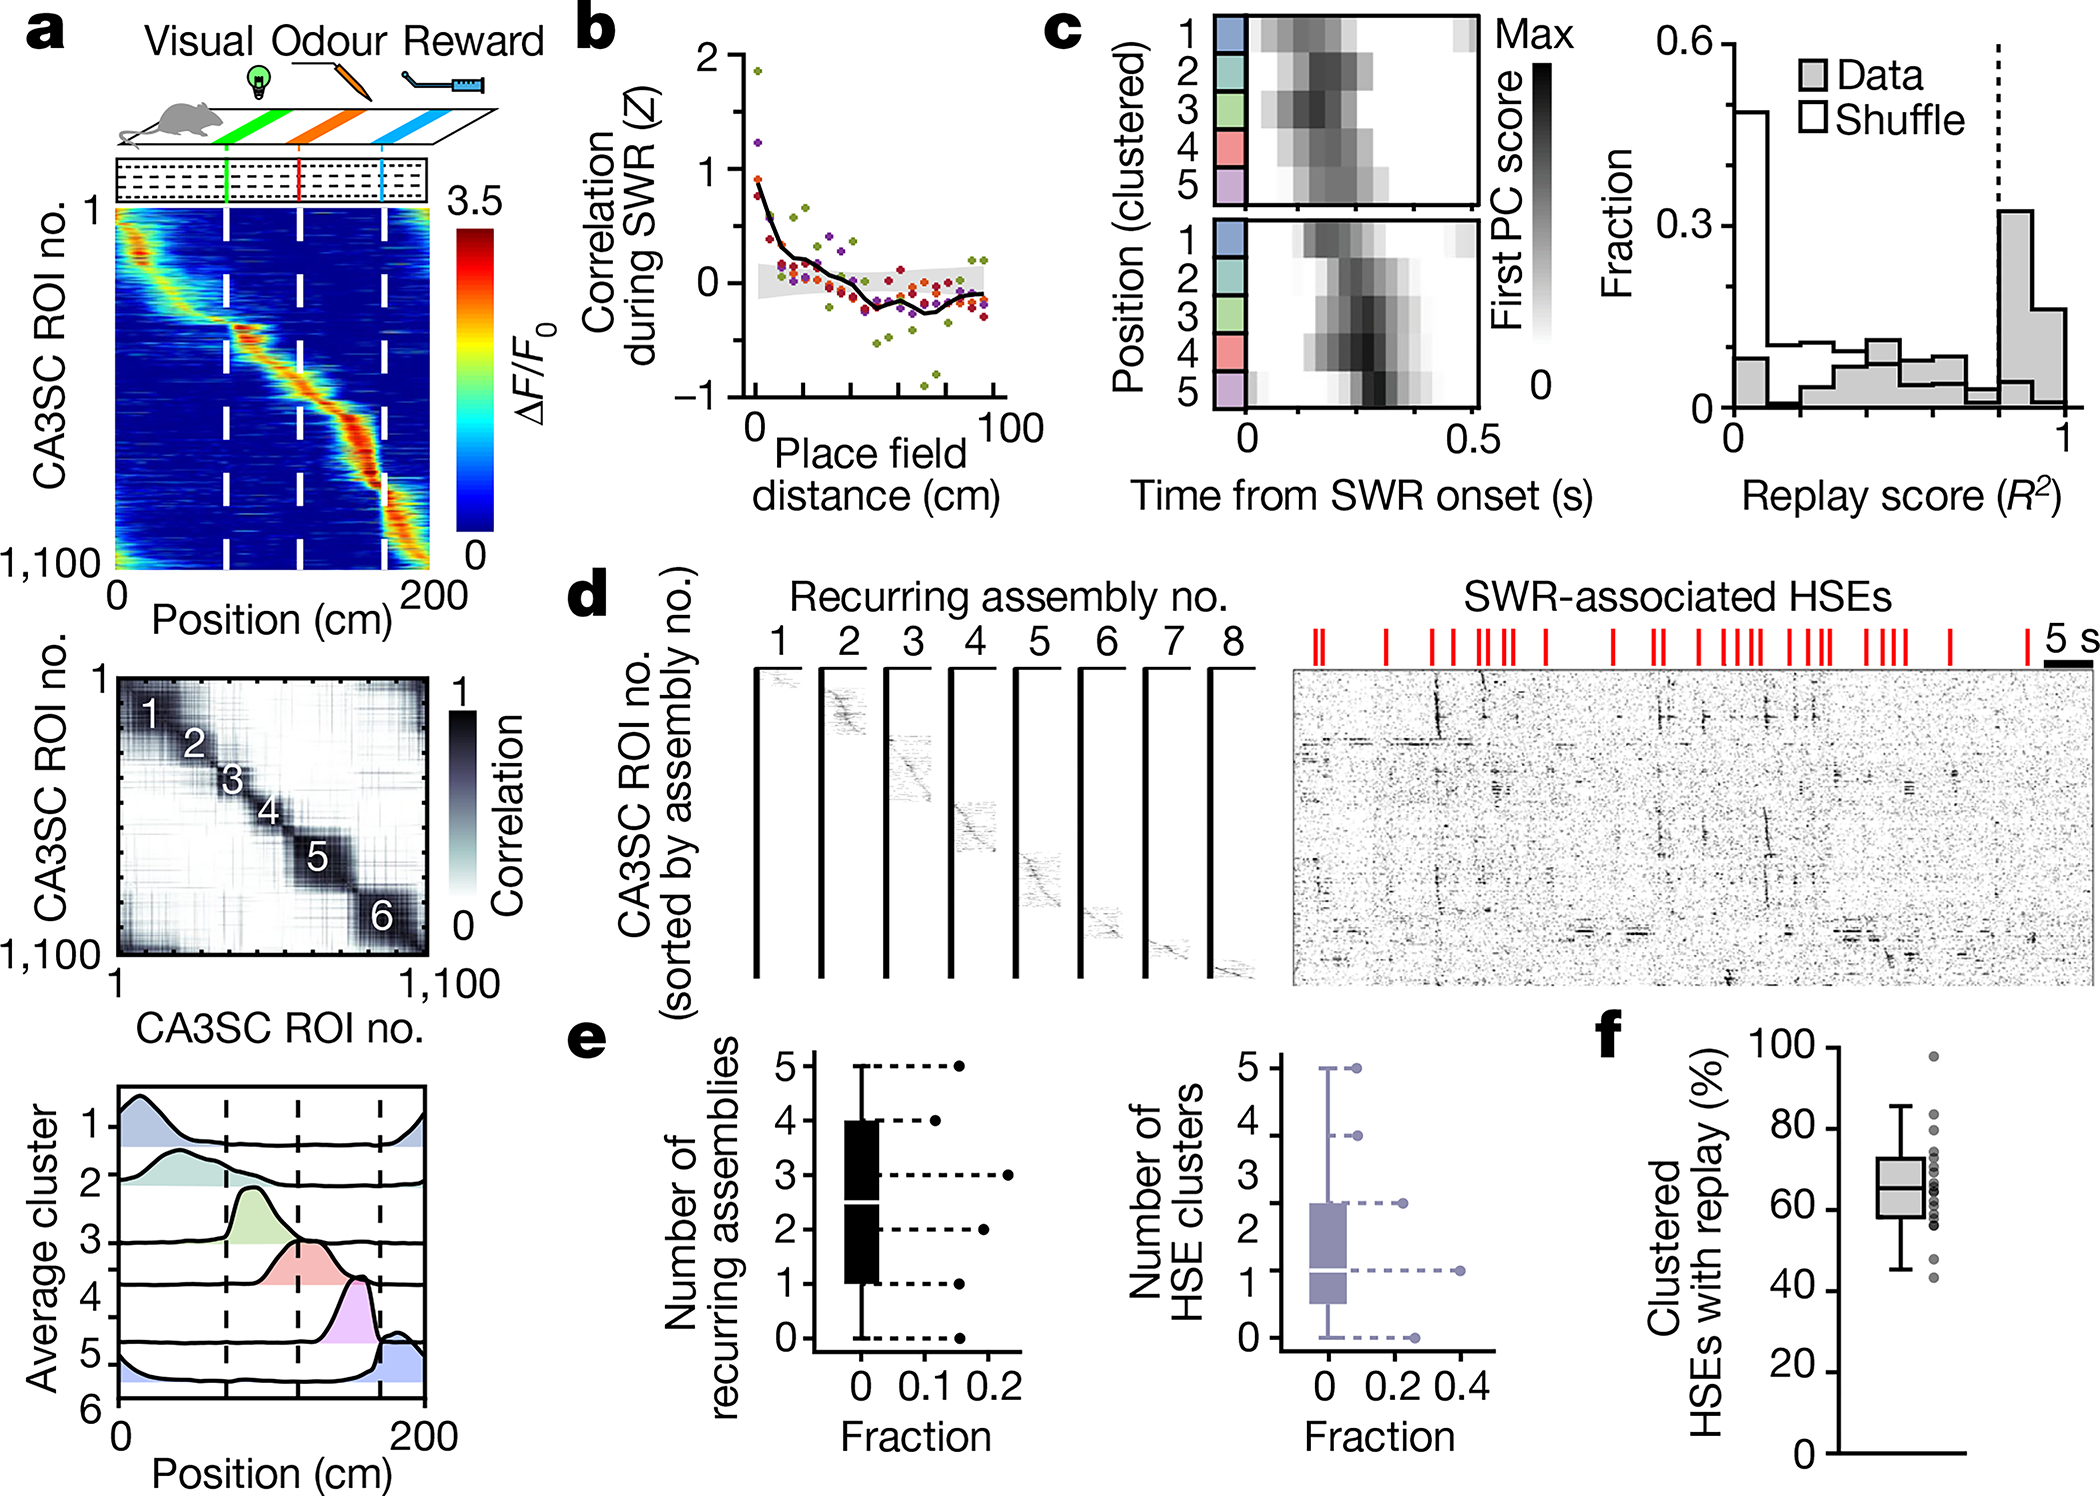
Fig. 4 |. Replay of sensory cue-driven cognitive maps in CA3SCs.

a, Top, schematic of the fixed cue and non-spatial (FC-NS) task with an activity heatmap in which CA3SC ROIs are sorted by peak activity as a function of position for CA3SC ROIs with place fields. Middle, correlation matrix of the same CA3SCs. Bottom, average place field profile for discrete clusters identified on the basis of similarities between cue-evoked place fields (Methods). b, Pairwise cross-correlation at zero-time lag during SWR-associated HSEs for all CA3SCs with a place field, plotted against their place field peak in bins of 5 cm (n = 1,666,282 pairs, n = 4 mice). Each colour corresponds to an individual mouse; the black line indicates the mean with the grey shaded area indicating the 97.5% confidence interval from shuffled pairs. c, Left, representative SWR-associated replay events. Colours correspond to the clustered places from a (bottom). Right, distribution of real (grey) and shuffled (white) replay scores. Dashed line, 95th percentile (shuffle). d, Recurring assemblies of cue-place-CA3SCs during HSEs. Left, eight recurring sequential factors detected by convNMF (Methods and Extended Data Fig. 10). Right, ΔF/F0 traces sorted by latency of peak activation within the assembly. e, Left, number of recurring assemblies in HSE clusters. The white line indicates the median; box edges correspond to 25th and 75th percentiles. Whiskers extend to the maxima and minima. Right, number of HSE clusters in which each recurring assembly participated (n = 28 HSE clusters, n = 4 mice). f, Box plot indicating the fraction of recurring assembly-containing HSEs in each cluster that also contained replay sequences (n = 19 HSE clusters with assemblies from four mice). Whiskers extend to the maxima and minima, with outliers excluded. Dots correspond to individual HSE clusters.
