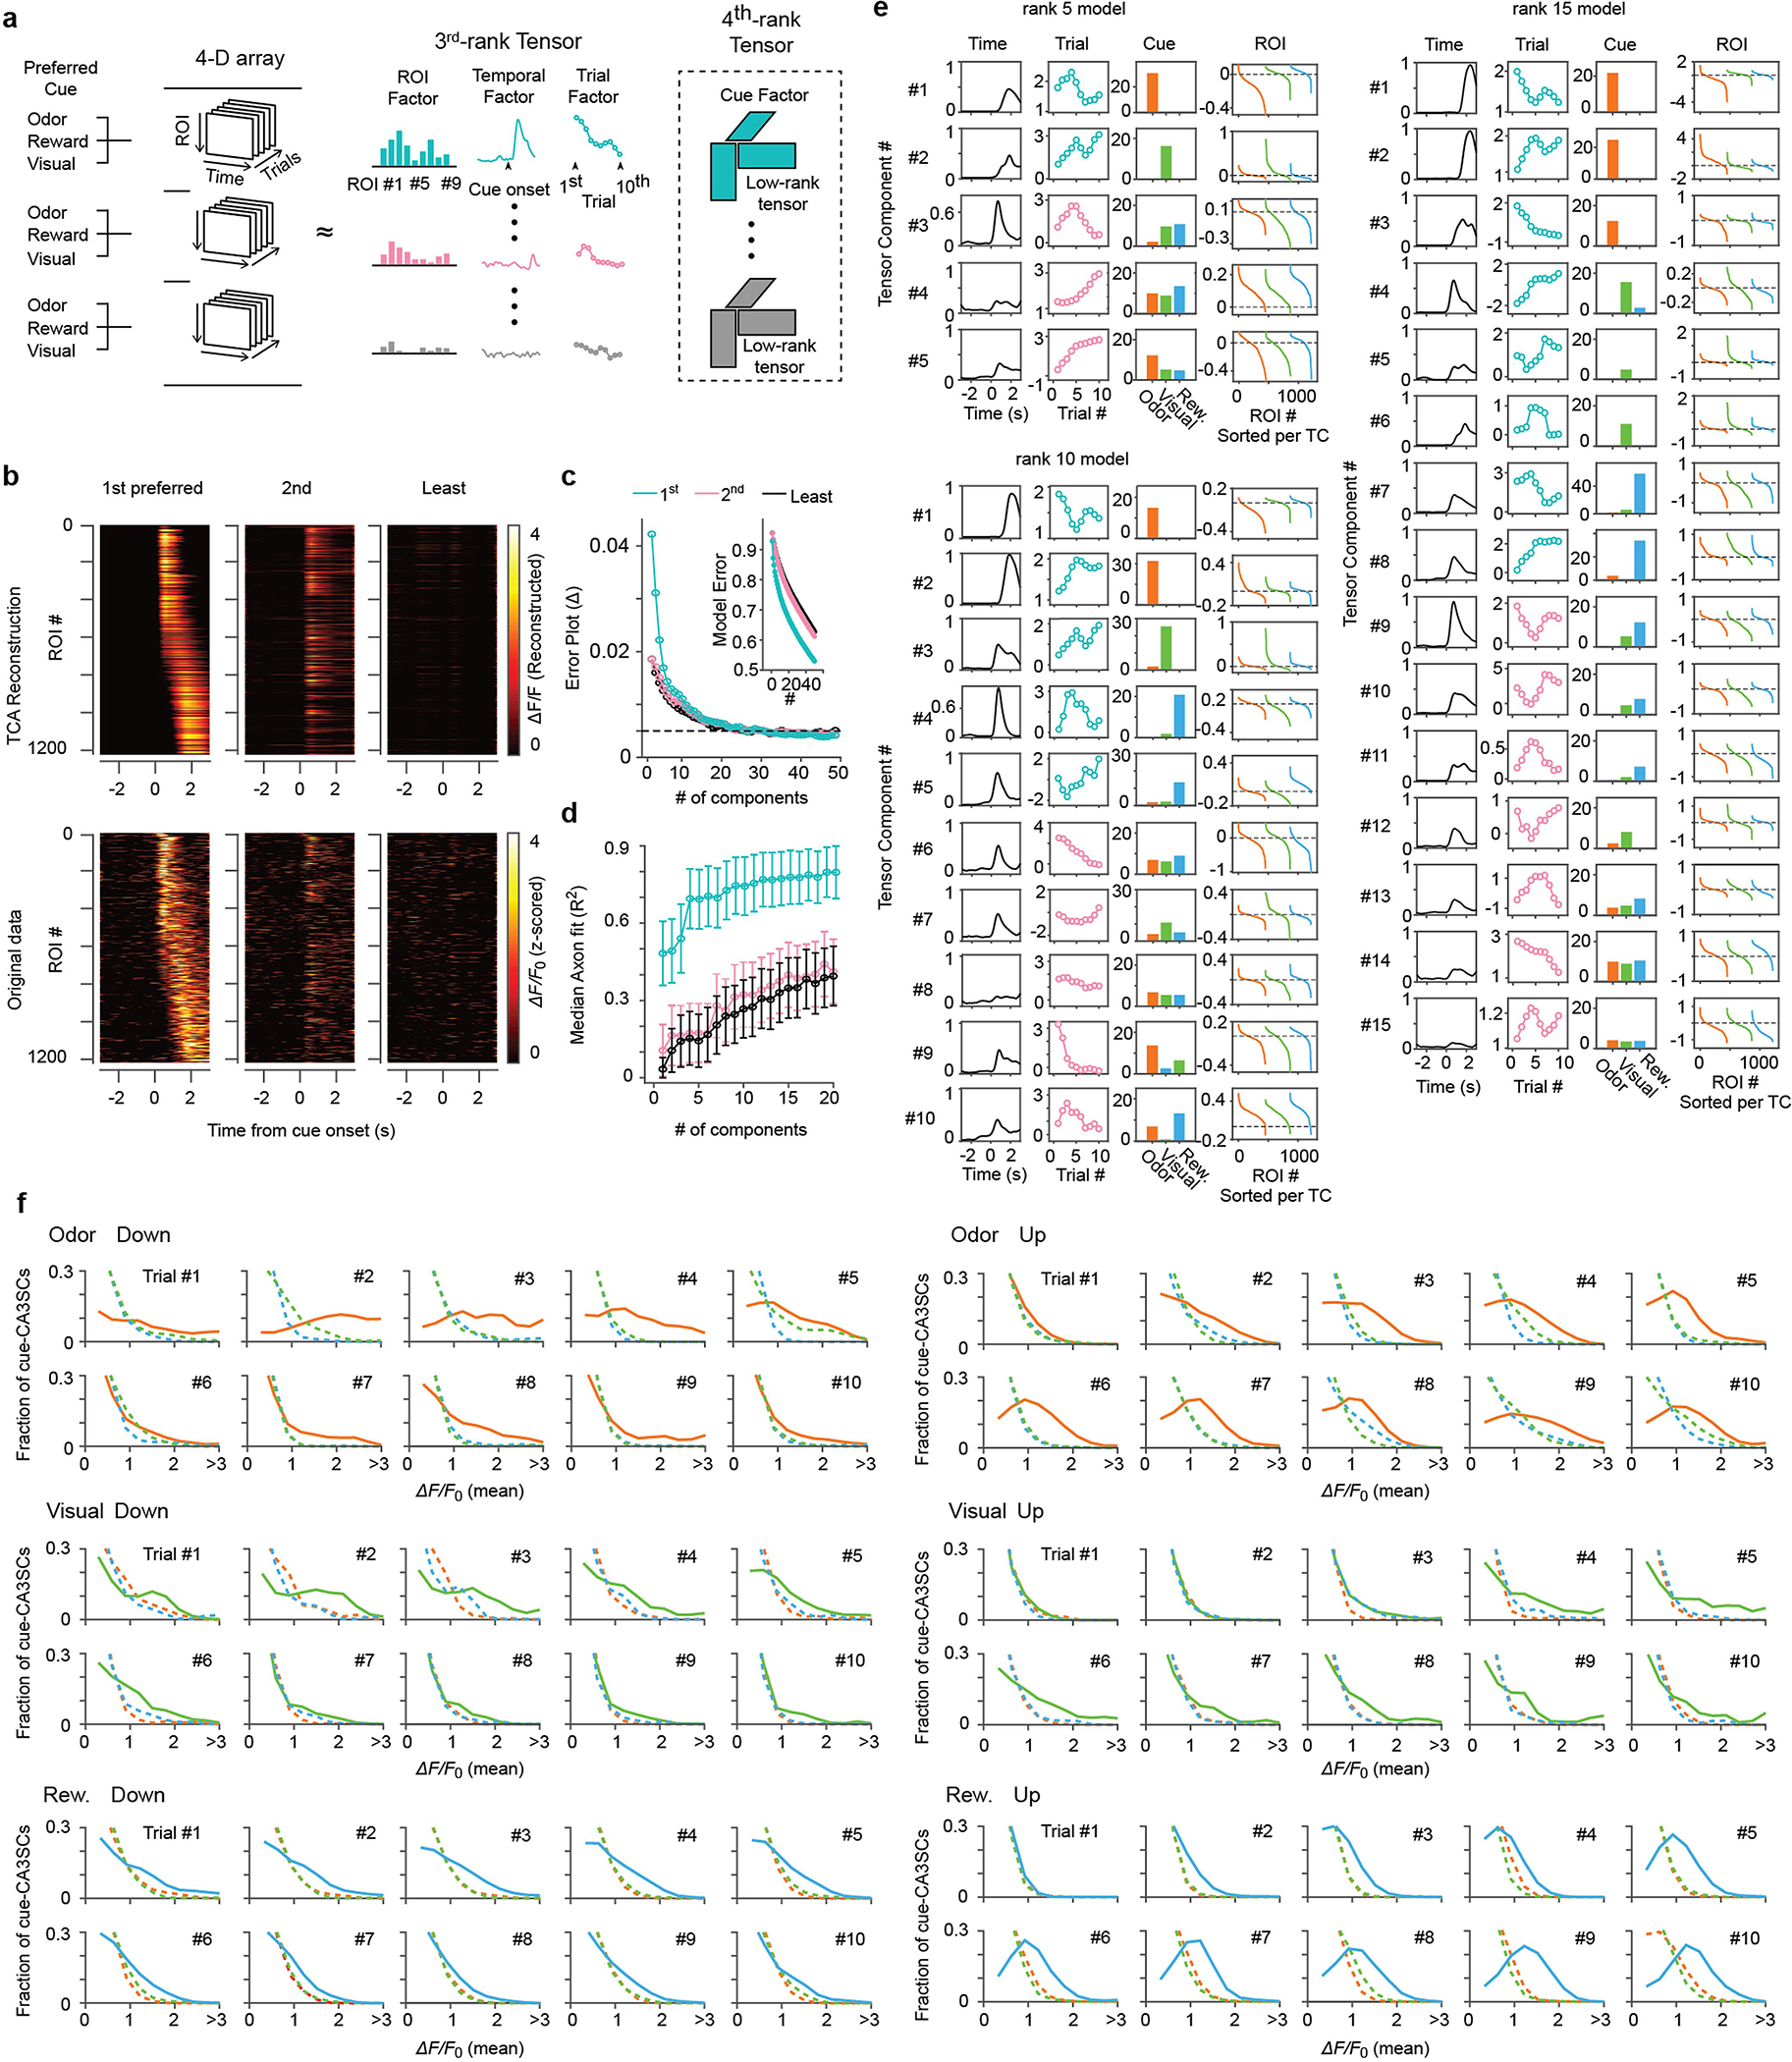
Extended Data Fig. 4 |. Multi-axis dimensionality reduction of trial-by-trial changes in cue-CA3SC activity via Tensor Component Analysis.

a, Schematic of tensor component analysis (TCA). Imaging data were arranged into a 4th order tensor with dimensions N×T×K×C where axes correspond to the number of CA3SC ROIs, within-trial temporal dynamics, evolution over multiple trials, and cue modality. b, Reconstructed (top) and original (bottom) ΔF/F0 heatmaps, centered on cue onset, for cue-CA3SCs in response to their respective 1st preferred (left), 2nd preferred (middle), and least preferred (right) cues. A 10-component TCA model, shown in (e), was used for reconstruction. c, Error plot showing normalized reconstruction error for TCA (inset) and reduction in error with each additional component until 50 for 1st preferred (cyan), 2nd preferred (pink), and least preferred (black) cue. d, Median coefficients (R2)±s.d. of reconstruction for each cue-CA3SC with the number of components for TCA ranging from 1 to 20 (n=1219 ROIs from 6 mice). e, Extracted tensor components (TCs) from the 5, 10, 15-component models. Columns show temporal factor (left), trial factor (middle left), cue factor (middle right), and ROI factor (right). Cyan trial factor: TCs dominated by a single sensory modality (#1–5) Pink trial factor: multimodal TCs (#6–10). Unimodal TCs strongly contributed to reconstructed responses to their 1st preferred cues shown in (b) and represent modality-specific features within and across trials. f, Distributions of averaged ΔF/F0 response after cue onsets, by trial, in each cue-CA3SC cluster.
