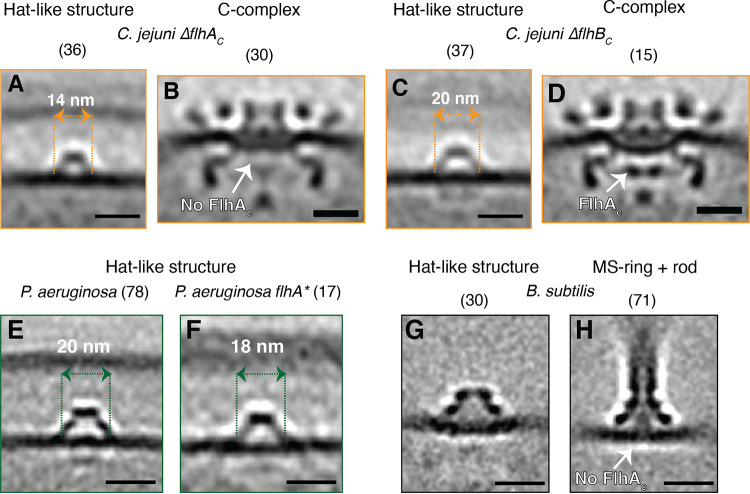
FIG 5.
Comparison of the hat-like structure and flagellar subcomplexes in fT3SScc mutants and lysed cells. (A–D) Central slices through subtomogram averages of the hat-like structure (A, C) and flagellar C-complex (B, D) in C. jejuni ΔflhAc (A, B) and ΔflhBc (C, D) cells. (E, F) Central slices through subtomogram averages of the hat-like structure in P. aeruginosa wild-type (E) and flhA* (F) cells. (G, H) Central slices through subtomogram averages of the hat-like structure (G) and a flagellar subcomplex constituting the MS-ring and rod (H) from lysed B. subtilis cells. (H) Adapted from (7). Numbers in parentheses indicate how many particles were used to produce the subtomogram average. Scale bars represent 20 nm.

