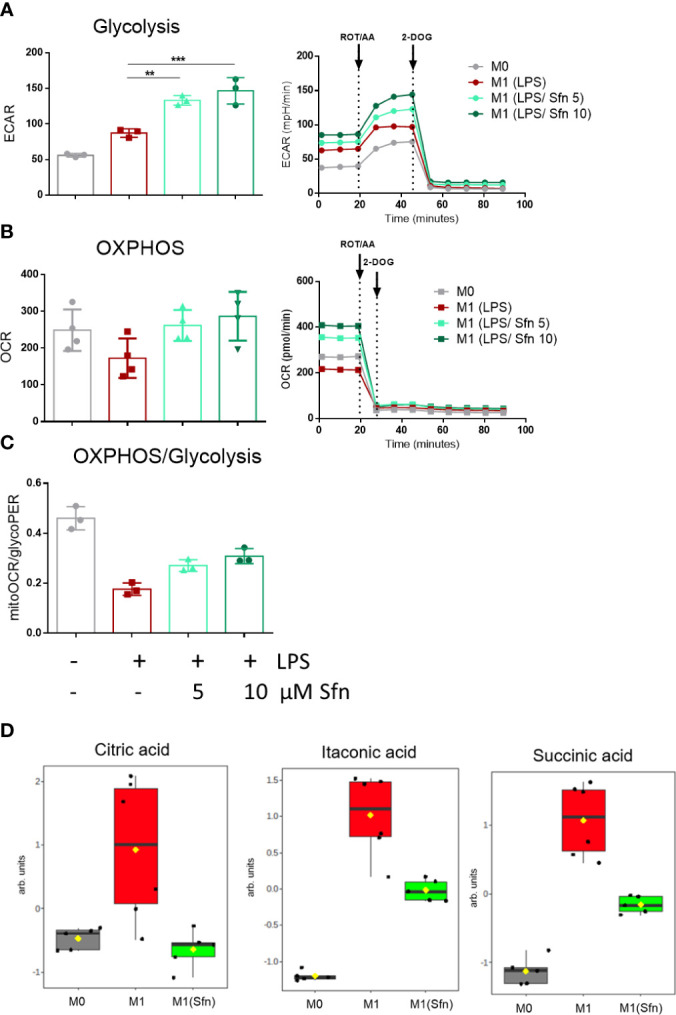
Figure 3.

Sfn leads to high glycolytic and respiratory activities and blunts TCA cycle breaks in M1 (LPS) macrophages. IBMDM macrophages were pretreated with DMSO or with the indicated concentrations of Sfn for 30 min before they were stimulated with LPS (25 ng/ml) for 24 h. A total of 100,000 cells were then subjected to glycolytic rate assay and extracellular flux analysis as described in detail in the Methods section. (A) Depicts glycolytic activity (as evident in extracellular acidification rate (ECAR) in mPH/min), (B) OXPHOS activity (as evident oxygen consumption rate (OCR) in pmol/min), and (C) the ratio between basal mitoOCR/glycoPER. Bar graphs depict compiled data of basal ECAR and/or OCR from three different biological replicates given as mean ± SD. (** p < 0.01; *** p < 0.001; ANOVA, followed by multiple comparisons test). Graphs on the right show exemplary data from the performed glycolytic rate assays. (D) MS-based determination of citrate, itaconate, and succinate levels in M0, M1 (LPS), and M1 (LPS/Sfn) after 24 h incubation ([Sfn] = 10 µM). Graphs depict compiled data from at least five independent biological replicates (arb. units, arbitrary units; detailed information can be found in the Methods section).
