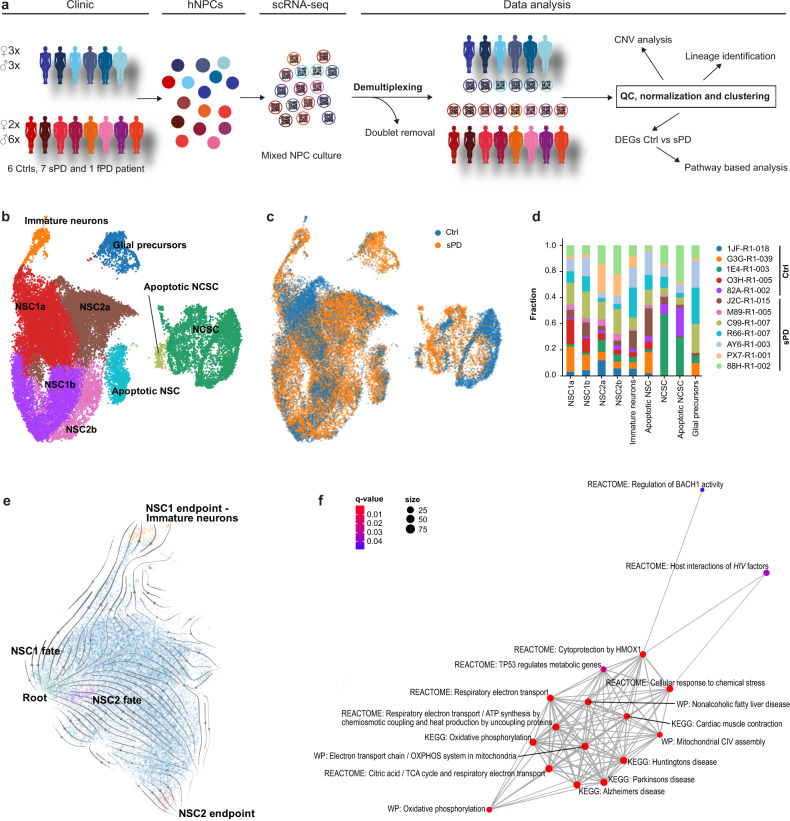
Fig. 3. scRNA-seq profiling and clustering.
a Experimental and bioinformatic workflow for multiplexing of 14 hNPC clones derived from 13 individuals. QC, quality control. b UMAP visualization of 30,557 annotated cells from 5 Ctrl and 7 sPD hNPC clones within the clusters NSC: neural stem cells, immature neurons, glial precursors, NCSC: neural crest stem cells and apoptotic NSC / NCSC. c UMAP visualization with annotations for the disease condition (Ctrl, sPD). d Contribution of individual patients to clusters. e RNA velocity analysis revealed two NSC trajectories on immature neurons (NSC1 fate) and NSC populations (NSC2 fate) as well as one developmental point of origin (root) after cell cycle effects were regressed out. f Detail of the network of enriched canonical pathways for DEGs of the root population with edges weighted by the ratio of overlapping gene sets. FDR corrected p-values are represented by q-values. Complete network is presented in Supplementary Fig. 3a.

