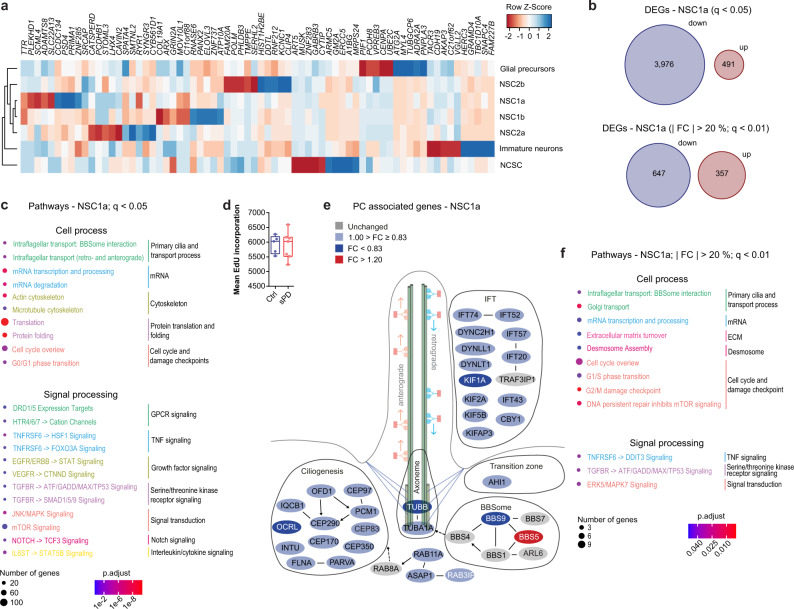
Fig. 4. Cluster specific gene expression changes in sPD pathology.
a Heatmap showing log2 transformed fold changes (FC) with columns scaled by z-score for the top ten up- and downregulated DEGs of each cell cluster. Hierarchical clustering of cell types represented by the dendrogram reveals their similarity across DEGs. b Number of all and most (| FC | > 20%, q < 0.01) up- and downregulated DEGs in NSC1a. c Enriched pathways of the categories Cell process and Signal processing analyzed using Pathway Studio for the DEGs of NSC1a (q < 0.05). P-values were determined by one-sided Fisher’s exact tests. FDR corrected p-values are represented by q-values. d Cell proliferation rate of hNPCs determined by EdU incorporation after 2 h of EdU treatment. n = 5 Ctrl and 7 sPD clones, in triplicates. P-values were determined by two-sided t-test. e Visualization of the “Intraflagellar transport: BBSome interaction” pathway with manual annotations. Up- (red) and downregulated (blue) genes are sorted into functional categories intraflagellar transport (IFT), transition zone, BBSome, axoneme, and ciliogenesis. Color intensity is proportional to fold change. f Enriched pathways of the categories Cell process and Signal processing analyzed using Pathway Studio for the DEGs of NSC1a ( | FC | > 20%; q < 0.01). P-values were determined by one-sided Fisher’s exact tests. FDR corrected p-values are represented by q-values. Boxplots display the median and range from the 25th to 75th percentile. Whiskers extend from the min to max value. Each dot represents one patient. #p < 0.1, *p < 0.05, **p < 0.01, ***p < 0.001. Source data are provided as a Source Data file.

