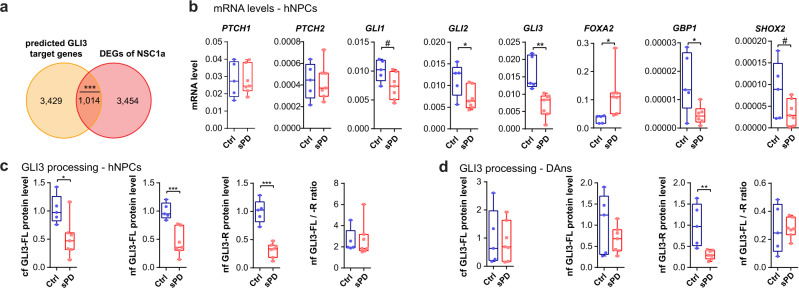
Fig. 6. Primary cilia dysfunction in sPD.
a Overlap of genome wide predicted GLI3 target genes using the MatInspector (Genomatix) with all DEGs from NSC1a. b Normalized gene expression levels of the SHH receptors PTCH1, PTCH2, the SHH transcription factors GLI1, GLI2, GLI3 and other signaling targets FOXA2, GBP1, SHOX2 analyzed on mRNA level by RT-qPCR in hNPCs. c Quantification of full length GLI3 (GLI3-FL) and GLI3 transcriptional repressor (GLI3-R) in the cytoplasmic (cf) or nuclear (nf) fraction of protein extracts from hNPCs and (d) DAns analyzed by Western blot. Cf and nf GLI3 levels were normalized to levels of ACTB or H1-0, respectively. All experiments were performed in triplicates, n = 5 Ctrl and 7 sPD clones. Boxplots display the median and range from the 25th to 75th percentile. Whiskers extend from the min to max value. Each dot represents one patient. P-values were determined by two-sided t-test b (PTCH1 p = 0.9180; PTCH2 p = 0.9333; GLI1 p = 0.0508; GLI2 p = 0.0402; GLI3 p = 0.0030; GBP1 p = 0.0318; SHOX2 p = 0.0986), c (cf GLI3-FL p = 0.0156; nf GLI3-FL p = 0.0009; GLI3-R p = 0.0001), d (cf GLI3-FL p = 0.8308; nf GLI3-FL p = 0.2297; GLI3-R p = 0.0048; nf GLI3-FL/R ratio p = 0.9541); two-sided Mann-Whitney-U test b (FOXA2 p = 0.0303), c (nf GLI3-FL/R ratio p = 0.9001); one-sided Fisher’s Exact Test a (p = 3.31 × 10⁻¹³). #p < 0.1, *p < 0.05, **p < 0.01, ***p < 0.001. Scale bars = 10 µm. Source data are provided as a Source Data file.

