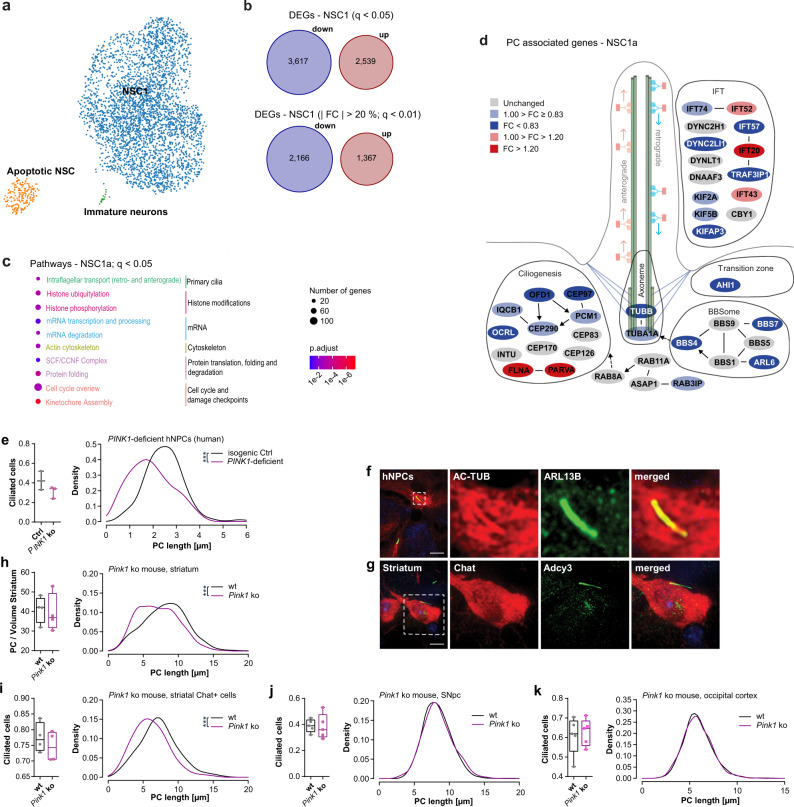
Fig. 9. Primary cilia in fPD.
a UMAP visualization of 3671 annotated cells from a PINK1 ko and isogenic Ctrl hNPC cell line within the clusters NSC: neural stem cells, apoptotic NSC, and immature neurons. b Number of all and most (| FC | > 20%; q < 0.01) up- and downregulated DEGs in the NSC1 cluster. FC, fold change. c Enriched pathways of the categories Cell process analyzed using Pathway Studio for the DEGs of the NSC1 cluster. P-values were determined by one-sided Fisher’s exact tests. FDR corrected p-values are represented by q-values. d Visualization of the “Intraflagellar transport: BBSome interaction” pathway with manual annotations. Up- (red) and downregulated (blue) genes are sorted into functional categories intraflagellar transport (IFT), transition zone, BBSome, axoneme, and ciliogenesis. Color intensity is proportional to fold change. e (right) Density plot illustrating the distribution of PC length (in µm) in a hNPC population. (left) Fraction of ciliated cells. PC length was measured in immunostainings of PINK1 ko and isogenic Ctrl hNPCs with anti-ARL13B. n = 38-89 cilia per clone and replicate (three independent differentiations). f PC immunostaining with anti-AC-TUB and anti-ARL13B exemplarily shown for isogenic Ctrl of PINK1 ko hNPCs. g PC immunostaining with anti-Chat and anti-Adcy3 exemplarily shown for a Pink1 ko mice. h (left) Fraction of ciliated cells (in a striatal volume of 115 µm x 87 µm x 40 µm) and (right) density plot illustrating the distribution of PC length (in µm) in the mouse dorsal striatum (n = 206-256 cilia per mouse) and i mouse striatal cholinergic neurons (n = 46-100 cilia per mouse). Fraction of ciliated cells and PC length was measured in 40 µm free floating brain sections from 4 Pink1 ko and 4 wt mice immunostained with anti-Adcy3 and h anti-Rbfox3 or i anti-Chat. j (left) Fraction of ciliated cells and (right) density plot illustrating the distribution of PC length (in µm) in the mouse SNpc (n = 172-300 cilia per mouse) and the k occipital cortex (n = 210-636 cilia per mouse). Fraction of ciliated cells and PC length was measured in 40 µm free floating brain sections from 5 Pink1 ko and 5 wt mice immunostained with anti-Adcy3 and anti-Rbfox3. Boxplots display the median and range from the 25th to 75th percentile. Whiskers extend from the min to max value. Each dot represents one mouse or replicate. P-values were determined by two-sided Mann-Whitney-U test e (left - p = 0.4000); two-sided t-test h (left p = 0.7697), i (left p = 0.4236), j (left p = 0.9034), k (left p = 0.7527); two-sided Kolmogorov-Smirnov test (ks) + linear mixed effects model (lm) e (right - ks p = 7.2 × 10⁻⁸; lm p = 0.025), h (right - ks p = 3.4 × 10⁻¹²; lm p = 1.6 × 10⁻⁴), i (right - ks p = 4.6 × 10⁻⁵; lm p = 1.2 × 10⁻³), j (right - ks p = 0.34; lm p = 0.72), k (right - ks p = 0.34; lm p = 0.73). *p < 0.05, **p < 0.01,***p < 0.001. Scale bar = 10 µm. Source data are provided as a Source Data file.

