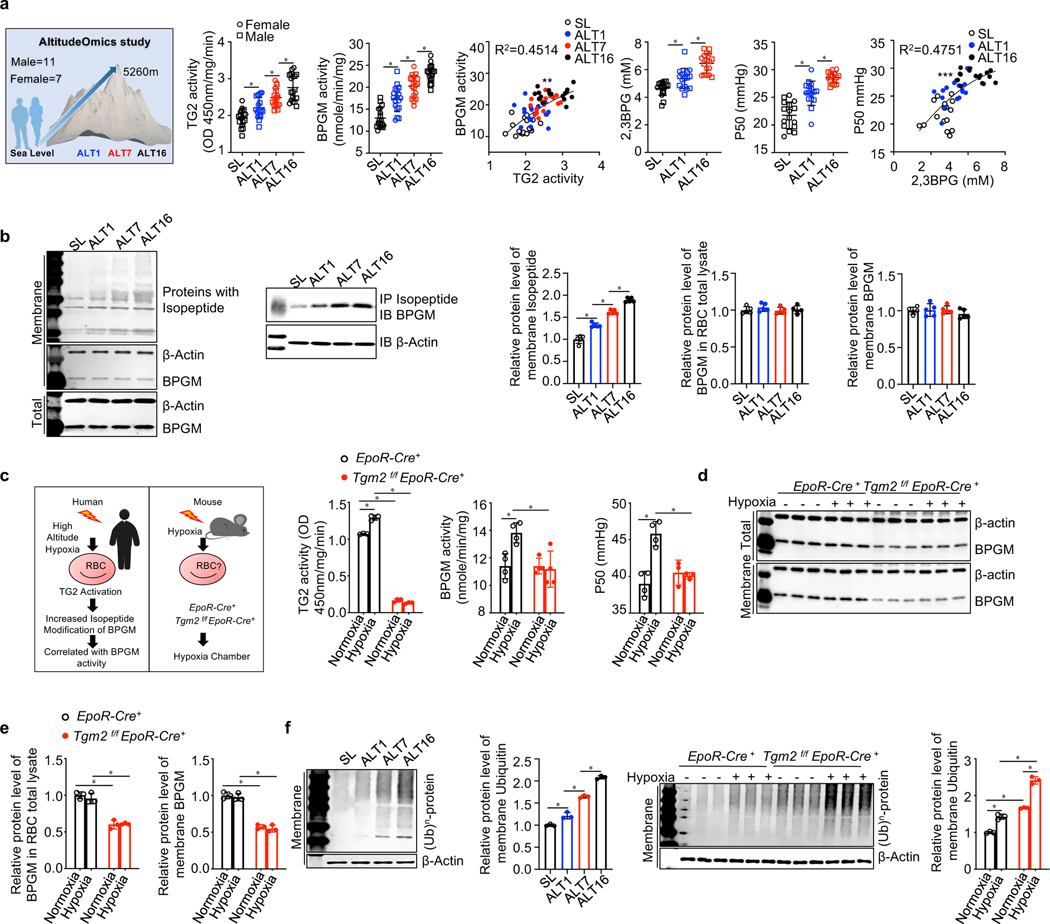
Figure 1. Hypoxia Induces eTG2 activity in both humans and mice.
a. Schematic representation of AltitudeOmics project design; TG2 & BPGM activity, 2,3-BPG and P50 in human erythrocytes at sea level (SL) and at high altitude on day 1 (ALT1), day 7 (ALT7) or day 16 (ALT16). Circles represent females, squares represent males. *P<0.05, (n=16–18). **P<0.05, Pearson correlation analysis, r2=0.4514. P50 was significantly correlated with 2,3BPG, ***P<0.05, Pearson correlation analysis, r2=0.4751.
b. Effect of high-altitude hypoxia on isopeptide modification and BPGM protein levels in human erythrocytes and IP Isopeptide followed by Western blot against BPGM; Protein bands were quantitated and normalized to the sea level. *P<0.05, (n=5).
c. Experimental design for mouse model of human hypoxia. Erythrocyte BPGM and TG2 activity were quantified in EpoR-Cre+ mice and Tgm2f/fEpoR-Cre+ mice under normoxia and hypoxia (10% O2 for 48h). *P<0.05, (n=3 or 4).
d-e. In vivo effect of hypoxia exposure on murine erythrocyte BPGM protein level (d). Protein bands were quantified and normalized to the EpoR-Cre+ mice under normoxia (e). *P<0.05, (n=3).
f. In vivo effect of high altitude hypoxia and hypoxia exposure on proteins modified by ubiquitin in human (left panel) and mouse (right panel) erythrocytes. Protein bands were quantified and normalized to humans at sea level and EpoR-Cre+ mice under normoxia. *P<0.05, (n=3). All of data are expressed as mean ± SD. Statistical analyses among SL, ALT1, ALT7 and ALT16 were conducted by one-way ANOVA followed with Sidak’s multiple comparisons test. Statistical analyses between EpoR-Cre+ and Tgm2f/fEpoR-Cre+ mice treated with or without Ang II were conducted by two-way ANOVA followed with Sidak’s multiple comparisons test. See also Figure S1, Figure S2 and Table S1.

