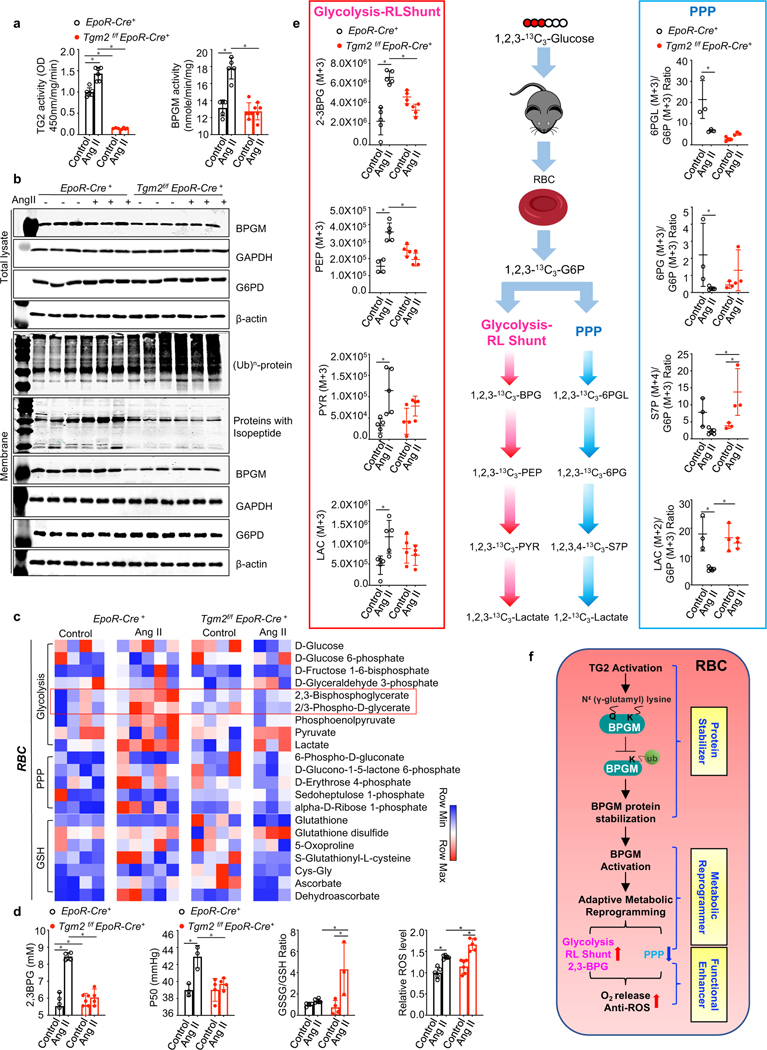
Figure 3. Beneficial role of erythrocyte TG2-mediated BPGM stabilization under pathological hypoxia by promoting erythrocyte adaptive metabolic reprogramming for enhanced O2 delivery.
a. BPGM activity and TG2 activity in EpoR-Cre+ and Tgm2f/fEpoR-Cre+ mice in Ang II infusion-induced CKD model. *P<0.05 (n=3–6).
b. Effect of Ang II-mediated pathological hypoxia on the protein levels of BPGM, GAPDH, G6PD, ubiquitin and isopeptide, followed with the quantification of protein bands by densitometry.
c. Heat map of erythrocyte glucose metabolism measured by untargeted metabolomics.
d. Erythrocyte 2,3-BPG levels were measured by commercially available kit. Erythrocyte oxygen release capacity (P50) was measured by a Hemox analyzer. The GSSG/GSH ratio was quantified by untargeted metabolomics. Erythrocyte ROS levels were detetermined by flow cytometry *P<0.05, (n=3–6).
e. In vivo flux experiments with 13C1,2,3-glucose to trace glucose metabolism between Glycolysis-RLShunt and PPP. Isotopically labeled 2,3-BPG (M+3), PEP (M+3), PY(M+3) LAC (M+3), and the ratio of 6PGL (M+3)/G6P (M+3),6PG (M+3)/G6P (M+3), S7P (M+4)/G6P (M+3), LAC (M+2)/G6P (M+3). *P<0.05, (n=3–5).
f. Schematic illustration of eTG2-dependent stabilization of BPGM protein in adaptive metabolic reprogramming and functional regulation in RBC. Data are expressed as mean ± SD and were analyzed by two-way ANOVA followed with Sidak’s multiple comparisons test. See also Figure S3.

