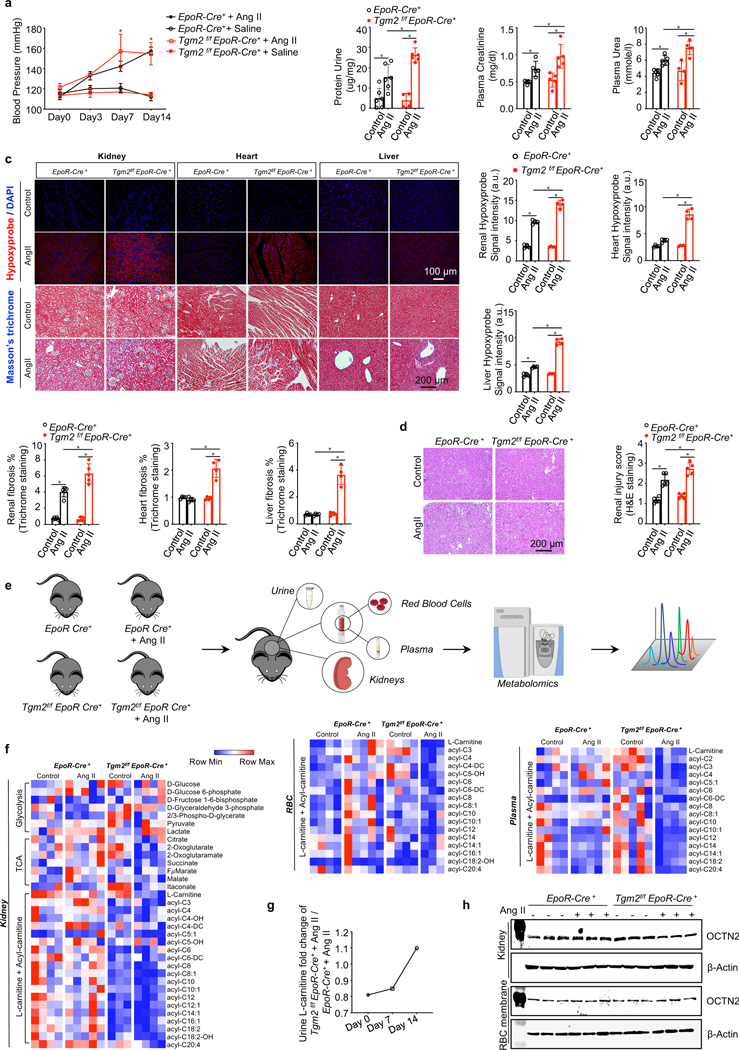
Figure 4. Erythrocyte TG2 deletion exacerbates Ang II-induced CKD manifestations and disturbs L-carnitine-dependent renal metabolism.
a. Systolic blood pressure (BP) was measured on days 0, 3, 7 and 14 of Ang II infusion. *P<0.05, Saline versus Ang II (n=4–6). kits. *P<0.05, (n=4–6).
b. Urinary protein, plasma creatinine and plasma urea were quantified by commercially available kits. *P<0.05, (n=4–6).
c. Top panel: Representative images of hypoxyprobe staining in kidney, heart and liver (scale bar=100 μm). Bottom panels: Representative images of Masson’s trichrome staining in kidney,heart and liver (scale bar=200 μm). *P<0.05 (n=4).
d. Representative hematoxylin and eosin (H&E) staining of sections of kidney cortex (scale bar=200 μm). *P<0.05, (n=4).
e. Experimental design for mouse sample collection and metabolomics study.
f. Untargeted metabolomics screening data indicated L-carnitine and acyl-carnitine loss in kidney, erythrocyte (RBC) and plasma, (n=3–5).
g. Urine L-carnitine fold change of Tgm2f/f EpoR-Cre+ + Ang II versus EpoR-Cre+ mice + Ang II.
h. Protein levels of OCTN2 in kidneys and erythrocyte membranes. All data are expressed as mean ± SD and were analyzed by two-way ANOVA followed with Sidak’s multiple comparisons test. See also Figure S4 and Table S2.

